Stock Market Outlook
For The Week Of April 3rd = Uptrend
INDICATORS
-
ADX Directional Indicators: Uptrend
Price & Volume Action: Uptrend
Elliott Wave Analysis: Mixed
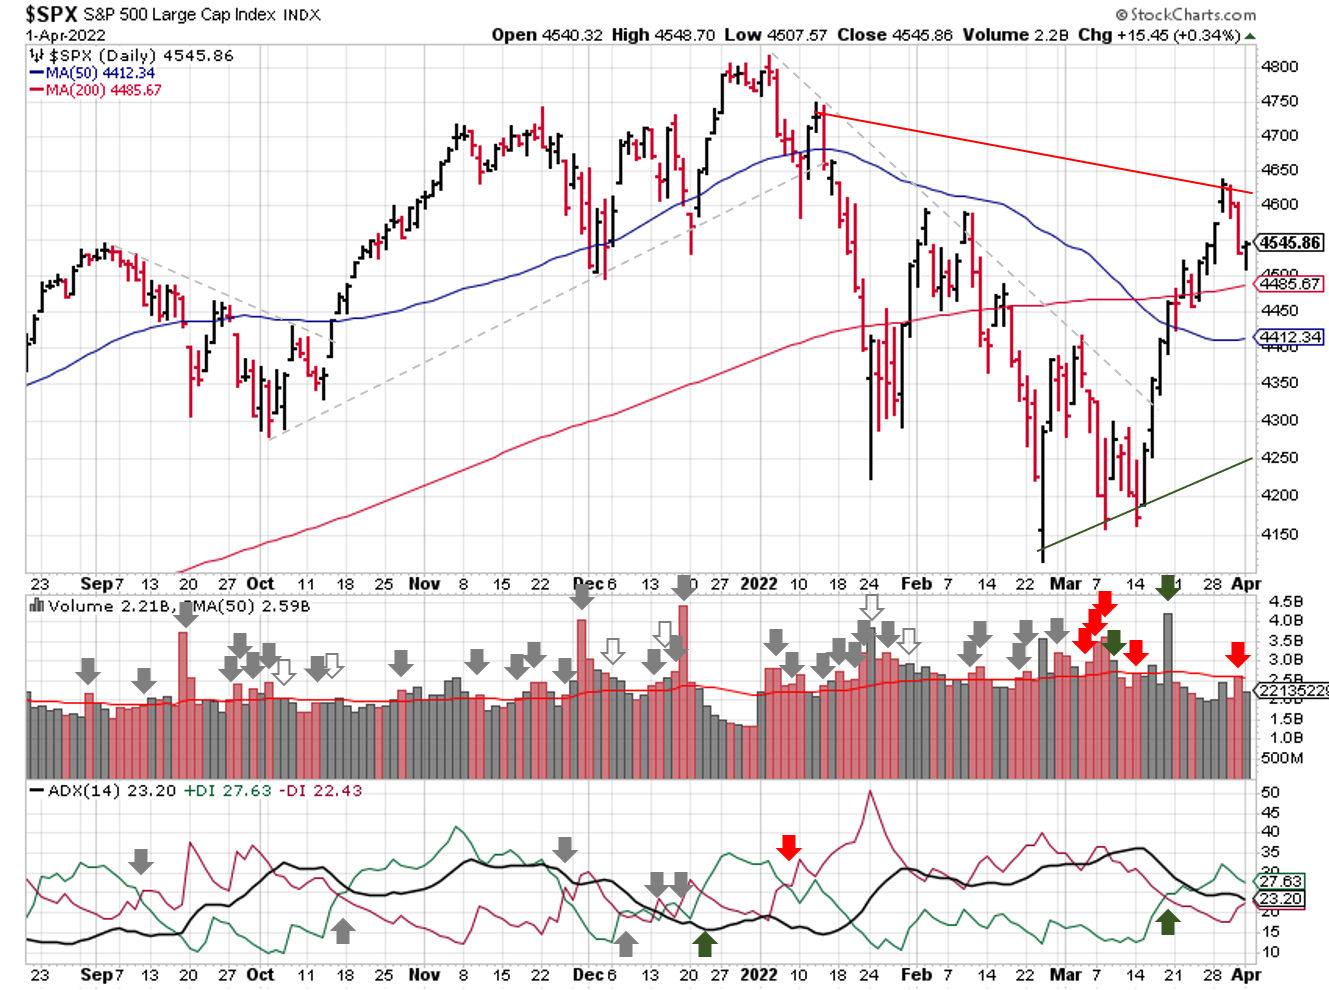
2022-04-03-SPX Trendline Analysis - Daily
Two of the three indicators used for the stock market outlook (ADX & price/volume) remain bullish.
Elliott Wave shifts to mixed, with the current wave count suggesting the downtrend is back underway or will be shortly. The SPX met retracement requirements for a typical B-wave, so Tuesday’s high could mark the end of the bear-market rally.
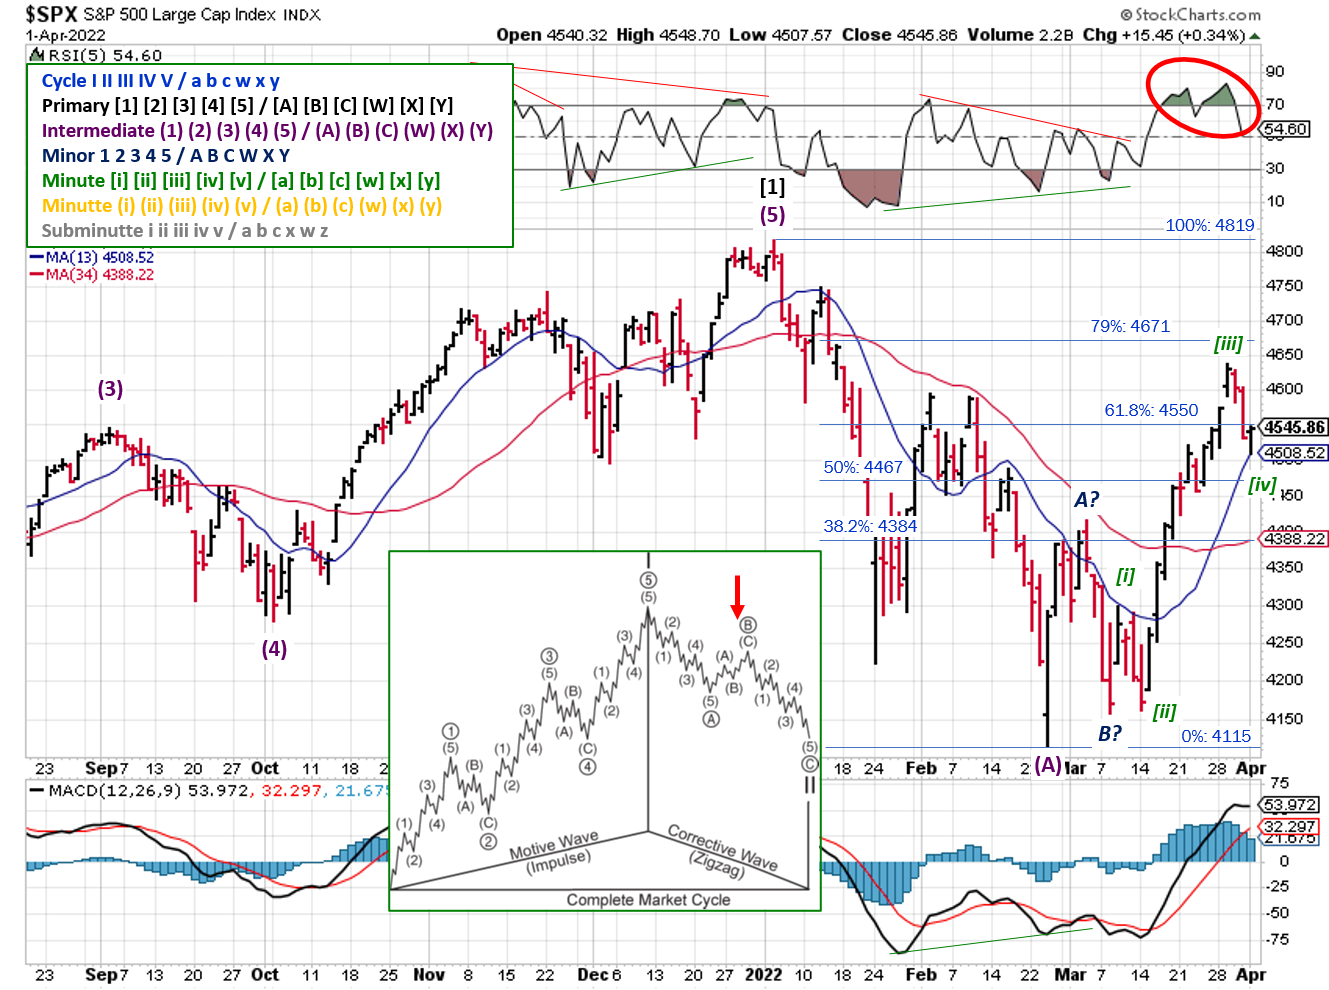
2022-04-03- SPX Elliott Wave Analysis - Daily - Primary 2
Looking more closely, there wasn’t a divergence in the RSI or the MACD. Even though divergences aren’t a must-have, they're useful confirmations. The RSI actually made a higher high, which is usually associated with a 3rd wave. That’s shown in the chart and puts the SPX in a Minute [iv].
Based on that analysis, I’m looking for one more run at the 4650 – 4670 before the Minor C / Intermediate B-wave completes. A drop below 4300 invalidates the [iv], and means that Tuesday’s high was indeed the completion of Intermediate B and the uptrend.
COMMENTARY
Guessing you heard something about the yield curve last week? If not, the "tens and twos" inverted, meaning that the yield on the 10-year treasury note was lower than the yield on the 2-year treasury note.
Normally, financial conditions farther out into the future are more uncertain, which means more risk of loss. To compensate, investors require higher yields. When the curve (or sections of it) inverts, the bond market expects higher uncertainty in the near term.
Right now, the curve appears to be adjusting to the Fed's rate hike plans. The 3-month sits just above the rate set by the Fed (~.25%) and the 2-year yield is ~2.45%, which is basically where the Fed wants to be after all their rate hikes.
Last week's jobs report contained all kinds of "positive" information: unemployment fell to 3.6%, average hourly earnings increased by 5.6% year-over-year, and labor force participation is climbing. These figures will be used as a sign that the economy is doing well, supporting the Fed's planned rate hikes.
But you know the name of the game is really GDP. If GDP is on the rise, then tightening monetary conditions will be uncomfortable but tolerable; the so-called "soft landing" mentioned by the talking-heads. If GDP is dropping, then tightening monetary conditions will be very painful and cause a lot of asset classes to lose value. In that case, better to run through your diversification checklist and resulting asset allocations before that happens.
In terms of stocks, you may find some cover in sectors like consumer staples, health care, and utilities, but that's not a guarantee. Each cycle is different.
And diversification doesn't necessarily mean you'll make money; sometimes you'll just lose less. It's all relative. If you reference the S&P500 like most investors, then a 5% drop in the SPX is your baseline for Q1, for example. If your portfolio only lost 3%, you actually outperformed the SPX by 2%. Diversification achieved!
Finally, sometimes cash is your best/only choice. And while it's true that adjusting for inflation means cash is losing value, that same adjustment makes losses in the stock market even worse.
Best To Your Week!
If you find this research helpful, please tell a friend. If you don't find it helpful, tell an enemy.
I regularly share articles and other news of interest via on Twitter (@investsafely), Facebook (InvestSafely),LinkedIn (Invest-Safely), and Instagram (@investsafely).

How to Make Money in Stocks: A Winning System in Good Times and Bad.
It's one of my favorites.
Invest Safely, LLC is an independent investment research and online financial media company. Use of Invest Safely, LLC and any other products available through invest-safely.com are subject to our Terms of Service and Privacy Policy. Not a recommendation to buy or sell any security.
Charts provided courtesy of stockcharts.com.
For historical Elliott Wave commentary and analysis, go to ELLIOTT WAVE lives on by Tony Caldaro. Current counts can be found at: Pretzel Logic, and 12345ABCDEWXYZ
Once a year, I review the market outlook signals as if they were a mechanical trading system, while pointing out issues and making adjustments. The goal is to give you to give you an example of how to analyze and continuously improve your own systems.
- 2015 Performance - Stock Market Outlook
- 2016 Performance - Stock Market Outlook
- 2017 Performance - Stock Market Outlook
- 2018 Performance - Stock Market Outlook
- 2019 Performance - Stock Market Outlook
- 2020 Performance - Stock Market Outlook
IMPORTANT DISCLOSURE INFORMATION
This material is for general communication and is provided for informational and/or educational purposes only. None of the content should be viewed as a suggestion that you take or refrain from taking any action nor as a recommendation for any specific investment product, strategy, or other such purpose. Certain information contained herein has been obtained from third-party sources believed to be reliable, but we cannot guarantee its accuracy or completeness.
To the extent that a reader has any questions regarding the applicability of any specific issue discussed above to his/her individual situation, he/she is encouraged to consult with the professional advisors of his/her choosing. Invest Safely, LLC is not a law firm, certified public accounting firm, or registered investment advisor and no portion of its content should be construed as legal, accounting, or investment advice.
The material is not to be construed as an offer or a recommendation to buy or sell a security nor is it to be construed as investment advice. Additionally, the material accessible through this website does not constitute a representation that the investments described herein are suitable or appropriate for any person.
Hypothetical Presentations:
Any referenced performance is “as calculated” using the referenced funds and has not been independently verified. This presentation does not discuss, directly or indirectly, the amount of the profits or losses, realized or unrealized, by any reader or contributor, from any specific funds or securities.
The author and/or any reader may have experienced materially different performance based upon various factors during the corresponding time periods. To the extent that any portion of the content reflects hypothetical results that were achieved by means of the retroactive application of a back-tested model, such results have inherent limitations, including:
Model results do not reflect the results of actual trading using assets, but were achieved by means of the retroactive application of the referenced models, certain aspects of which may have been designed with the benefit of hindsight
Back-tested performance may not reflect the impact that any material market or economic factors might have had on the use of a trading model if the model had been used during the period to actually manage assets
Actual investment results during the corresponding time periods may have been materially different from those portrayed in the model
Past performance may not be indicative of future results. Therefore, no one should assume that future performance will be profitable, or equal to any corresponding historical index.
The S&P 500 Composite Total Return Index (the "S&P") is a market capitalization-weighted index of 500 widely held stocks often used as a proxy for the stock market. Standard & Poor's chooses the member companies for the S&P based on market size, liquidity, and industry group representation. Included are the common stocks of industrial, financial, utility, and transportation companies. The S&P is not an index into which an investor can directly invest. The historical S&P performance results (and those of all other indices) are provided exclusively for comparison purposes only, so as to provide general comparative information to assist an individual in determining whether the performance of a specific portfolio or model meets, or continues to meet investment objective(s). The model and indices performance results do not reflect the impact of taxes.
Investing involves risk (even the “safe” kind)! Past performance does not guarantee or indicate future results. Different types of investments involve varying degrees of underlying risk. Therefore, do not assume that future performance of any specific investment or investment strategy be suitable for your portfolio or individual situation, will be profitable, equal any historical performance level(s), or prove successful (including the investments and/or investment strategies describe on this site).
Investing Process Links
Stabilize- Organize your $$$
- Manage your $$$
Plan
- Why You Invest
- Ways to Invest
- Where to Invest
- What to Invest In
Execute
- When to Invest
- How Much to Invest
- Buying & Selling
Monitor
- Track The Market
- Track Your Returns
Reflect & Adjust
- Improve Your Returns
- Adjust your Holdings
Popular Pages
- Jim Cramer- Personal Incomes Statements
- Hyperinflation
- Calculating Beta
- SMART Financial Goals
Blogroll
- Advisor Perspectives- Dividend Growth Investor
- Elliott Wave Lives On
- On My Radar | CMG Wealth
- Sure Dividend
- The Big Picture
- The Fat Pitch
- Thoughts from the Frontline
- Trader Feed
Sponsored Links
Invest Safely provides valuable, time-saving info about personal finance, money management, and investing.


