Stock Market Outlook
For The Week Of September 19th = Uptrend
INDICATORS
-
ADX Directional Indicators: Downtrend
Price & Volume Action: Mixed
Elliott Wave Analysis: Mixed
The S&P500 ($SPX) continues to trade within the upward price channel, but you can plainly see the increase in volatility and recent weakness.
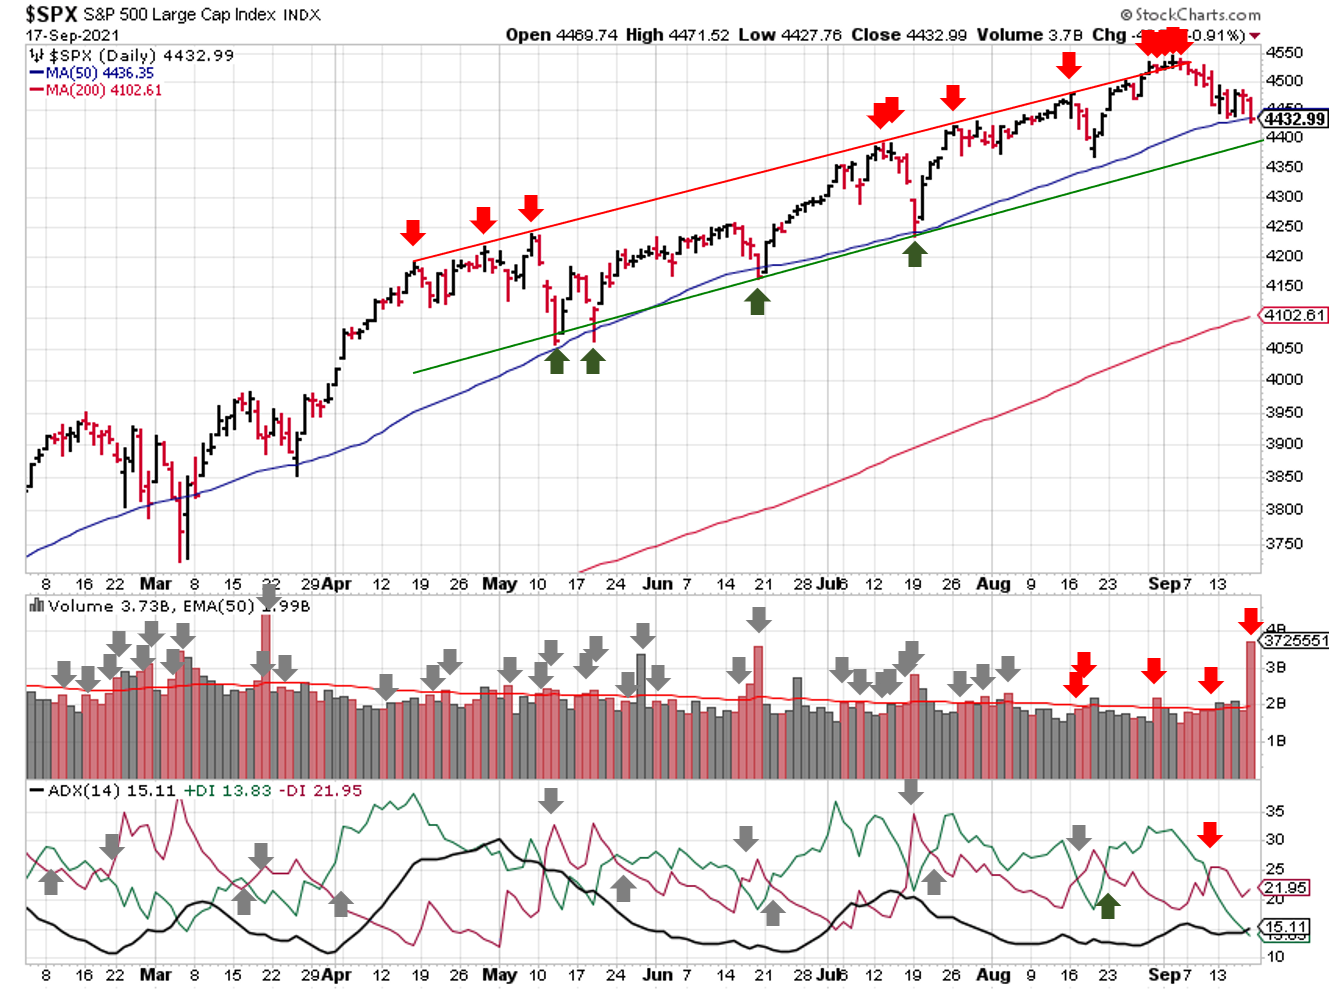
2021-09-19-SPX Trendline Analysis - Daily
The ADX signal maintains the downtrend signal based on the directional indicators, and a weak trend based on the ADX itself.
From a price and volume perspective, the signal is mixed to start the week. Friday’s distribution day has an asterisk, due to the extra trading volumes from option expiration. But even with that distribution day, the total over the past 5 weeks remains low (5).
However, price closed below the 50-day moving average for the first time since June, resulting in the mixed signal. That said, the S&P sits ~4 points below the 50, which is roughly .075%. Let's see what happens this week.
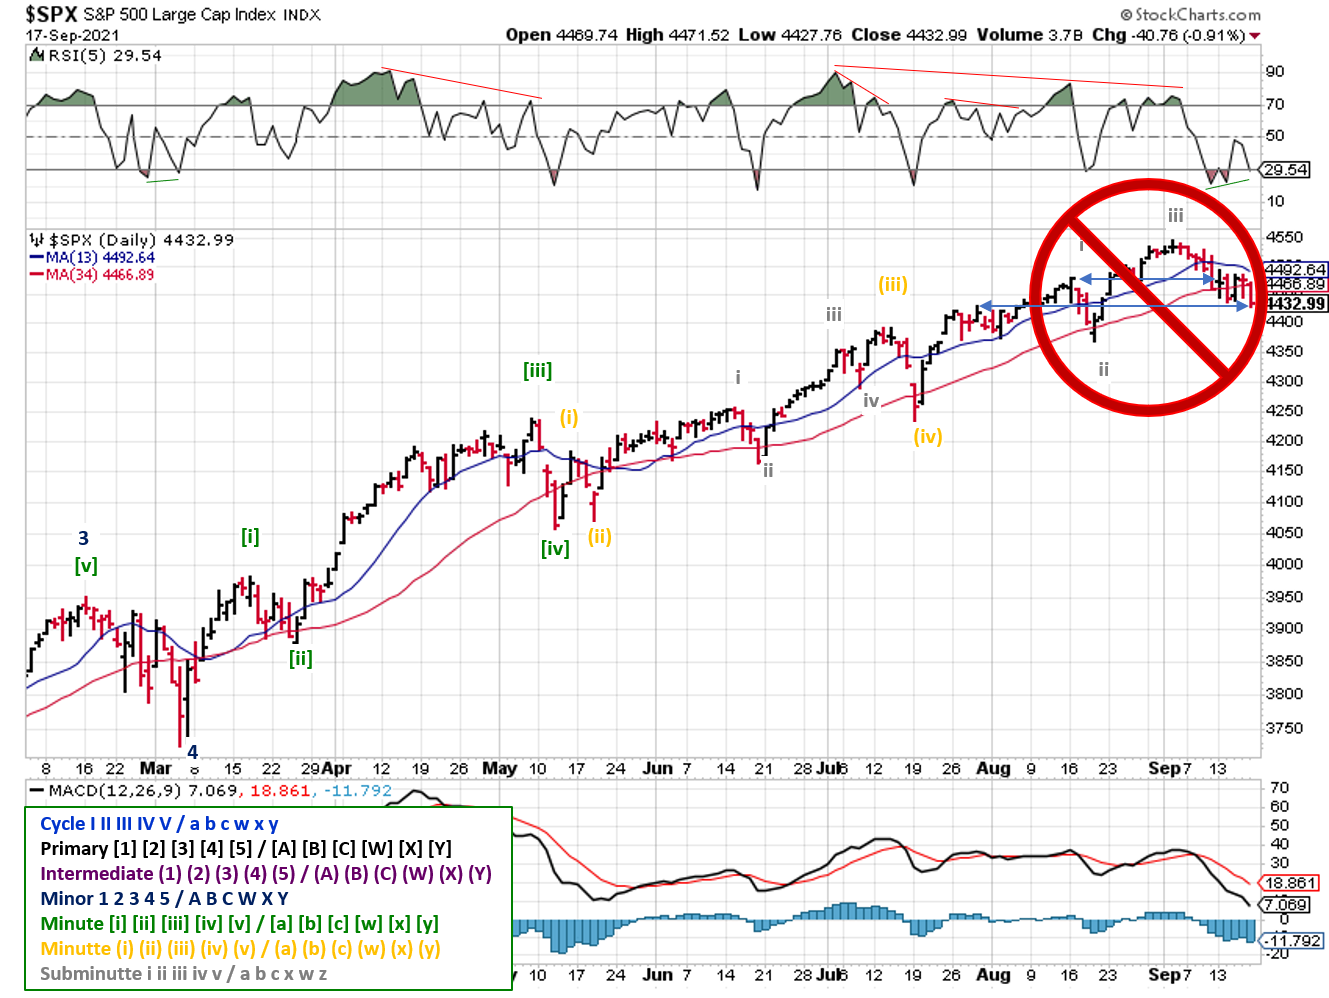
2021-09-19-SPX Elliott Wave Analysis - Daily - Primary 1
For Elliott Wave, the S&P500 is clearly correcting, but what’s not so clear is whether it’s within an uptrend or the start of a downtrend. So the signal remains mixed.
The RSI pattern didn't hold up, and neither did the 34-day moving average, indicating a change in market behavior. On the positive side, the RSI shows a positive divergence, so the S&P may be close to bottoming. At the moment, I think we're still in the 5th Intermediate Wave...probably the 3 minor wave. More analysis below.
COMMENTARY
The latest CPI report showed inflation moderating in August, as expected. This is the "transitory" aspect everyone is talking about. But this is on the heels of higher PPI numbers (meaning higher prices are still being felt in the supply chain). How much of that increase makes its way to the consumer remains to be seen.
Best to Your Week!
BONUS ANALYSIS
If you're interested, here are few more charts for the Elliott Wave Analysis.
Case 1
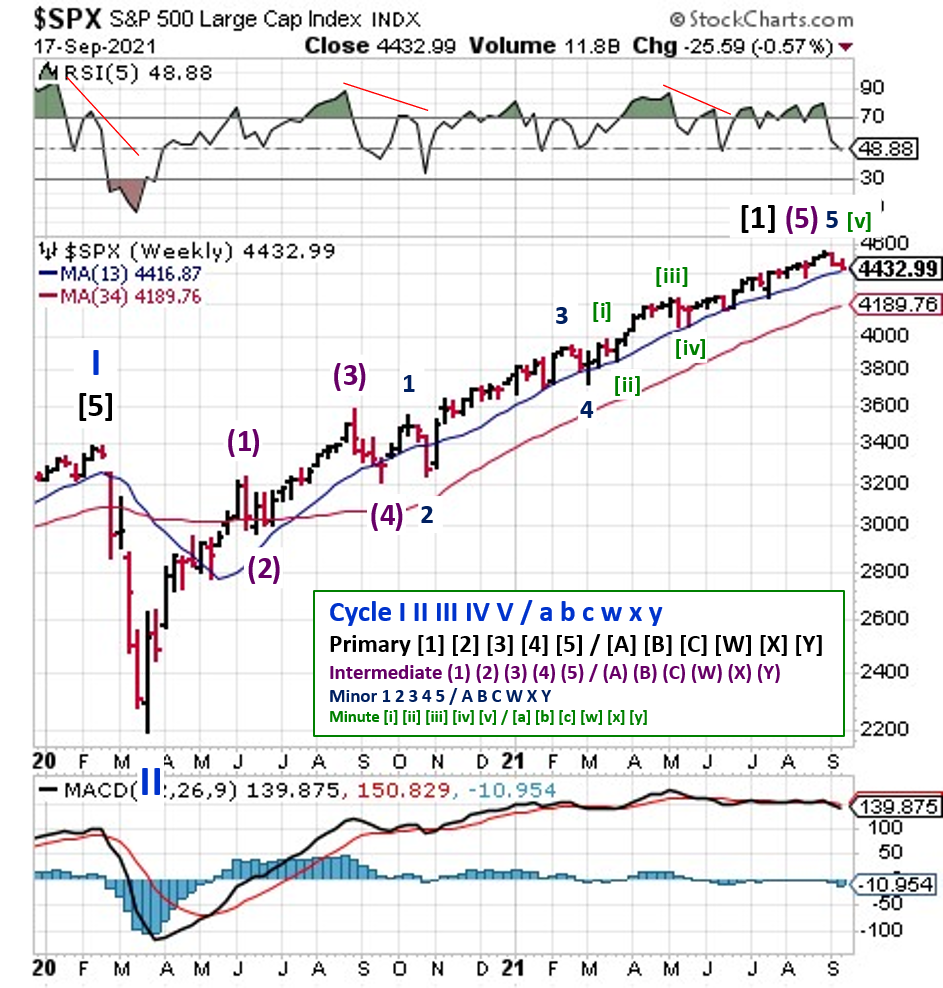
2021-09-19-SPX Elliott Wave Analysis - Weekly - Primary 2
If the original count for the "minute" waves was correct, then it’s likely that the Primary 1 just ended, and we’re in first impulse wave of the Primary 2 downtrend. There’s nothing “wrong” with the overall structure of the waves, with the Primary 1 lasting about the same amount of time as the last Cycle 1, Primary 1 (~1.5 years). And the intermediate, major, and minute waves all show long, 5th-wave extensions.
Case 2
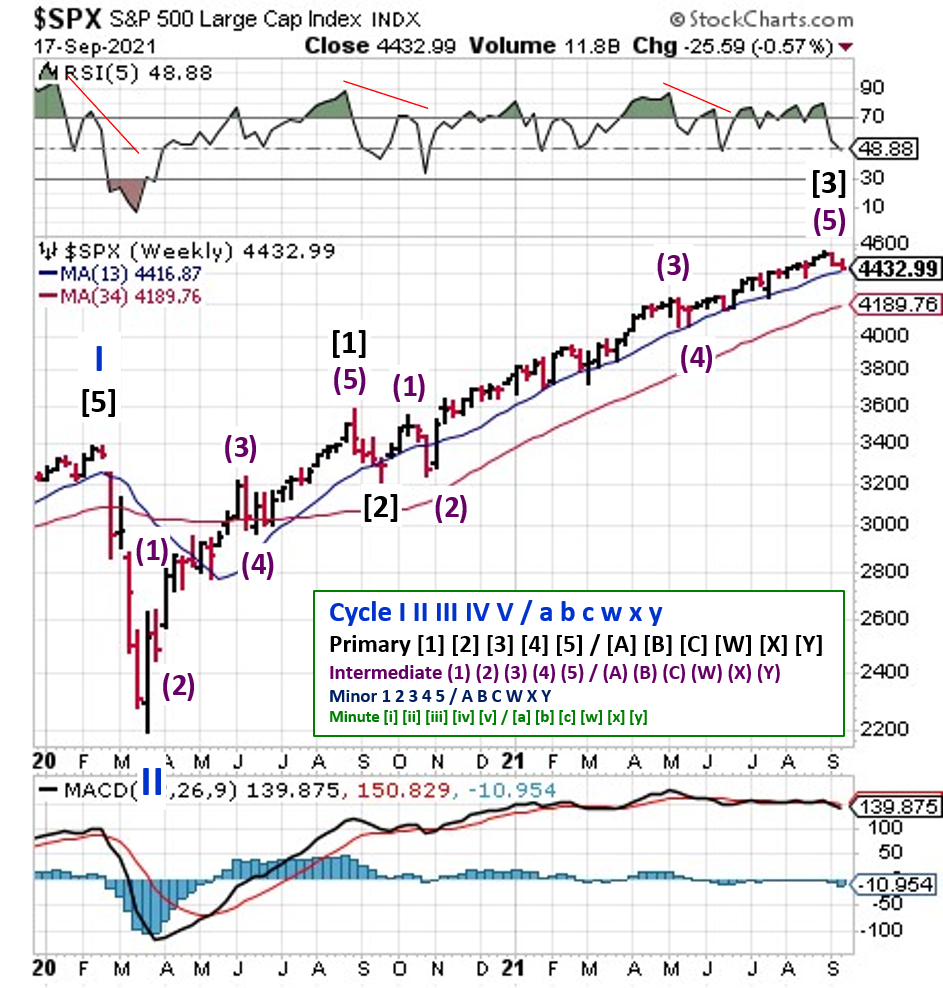
2021-09-19-SPX Elliott Wave Analysis - Weekly - Primary 4
I’ve seen some counts putting the S&P at the end of Primary 3, which would also put us in the first impulse wave of a downtrend; this time a Primary 4. The overall wave structure looks ok in terms of overlaps, but the timing and symmetry of the intermediate waves looks off. And the Primary 1 is too short when compared to the Cycle 1, Primary 1 back in 2009-2011.
Case 3
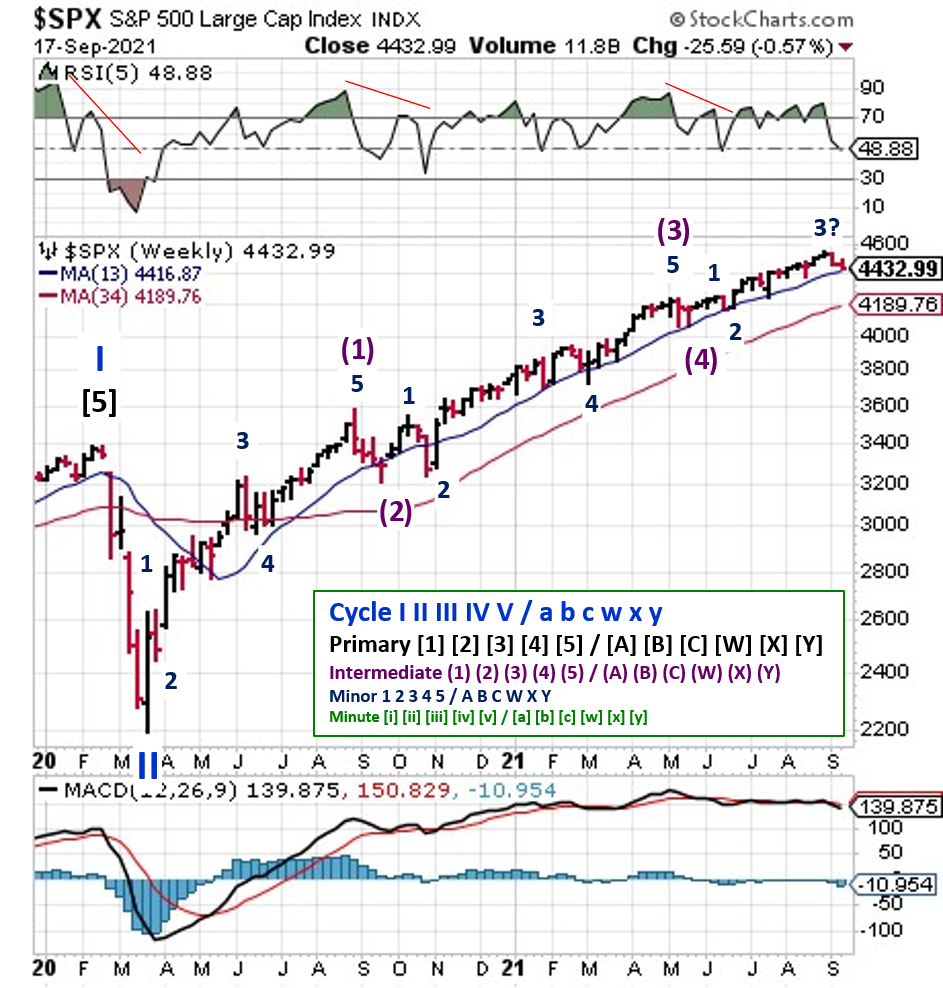
2021-09-19-SPX Elliott Wave Analysis - Weekly - Primary 1
If we use the overall structure from Case 2, and take it down a notch, in terms of wave type, the count puts the S&P500 in a minor 4 within the Intermediate 5. The RSI behavior matches up with minor/intermediate wave combinations better than intermediate/primary wave combinations. And the counts are more symmetrical. I still need to work with the first and second waves a bit, but you get the picture.I know September and October are historically bad months, but a Primary 2 has the potential to take us back towards the Cycle 2 low back in March 2020. That’s somewhere between 3050 and 2200...which means a 30 to 50% bear market. I don’t see Case 1 as a likely option given the current financial environment...let’s put that at 25% probability.
Case 2 would put the S&P500 into a big correction, with a lower bound near 3600 (~19% from last week’s close). Given the financial backdrop at the moment, that seems more plausible than a 30-50% drop, but I think we’ll need to start raising rates, see sustained inflation, and earnings misses before that happens. Plus, the technical indicators (RSI and MACD) don’t appear to support the end of a primary wave. Again, I don’t see this as a likely option either, so call it a 25% chance.
Case 3 seems most probable at the moment. Additional downside from the current correction would be limited compared to Cases 1 and 2. I put the probability on Case 3 around 50%.
If you find this research helpful, please tell a friend. If you don't find it helpful, tell an enemy.
I regularly share articles and other news of interest via on Twitter (@investsafely), Facebook, Linkedin, and Instagram (@investsafely)

How to Make Money in Stocks: A Winning System in Good Times and Bad.
It's one of my favorites.
Charts provided courtesy of stockcharts.com.
For historical Elliott Wave Analysis, go to ELLIOTT WAVE lives on by Tony Caldaro. Other interpretations can be found at: Pretzel Logic, and 12345ABCDEWXYZ
Once a year, I review the market outlook signals as if they were a mechanical trading system, while pointing out issues and making adjustments. The goal is to give you to give you an example of how to analyze and continuously improve your own systems.
- 2015 Performance - Stock Market Outlook
- 2016 Performance - Stock Market Outlook
- 2017 Performance - Stock Market Outlook
- 2018 Performance - Stock Market Outlook
- 2019 Performance - Stock Market Outlook
- 2020 Performance - Stock Market Outlook
IMPORTANT DISCLOSURE INFORMATION
This material is for general communication and is provided for informational and/or educational purposes only. None of the content should be viewed as a suggestion that you take or refrain from taking any action nor as a recommendation for any specific investment product, strategy, or other such purpose. Certain information contained herein has been obtained from third-party sources believed to be reliable, but we cannot guarantee its accuracy or completeness.
To the extent that a reader has any questions regarding the applicability of any specific issue discussed above to his/her individual situation, he/she is encouraged to consult with the professional advisors of his/her choosing. Invest Safely, LLC is not a law firm, certified public accounting firm, or registered investment advisor and no portion of its content should be construed as legal, accounting, or investment advice.
The material is not to be construed as an offer or a recommendation to buy or sell a security nor is it to be construed as investment advice. Additionally, the material accessible through this website does not constitute a representation that the investments described herein are suitable or appropriate for any person.
Hypothetical Presentations:
Any referenced performance is “as calculated” using the referenced funds and has not been independently verified. This presentation does not discuss, directly or indirectly, the amount of the profits or losses, realized or unrealized, by any reader or contributor, from any specific funds or securities.
The author and/or any reader may have experienced materially different performance based upon various factors during the corresponding time periods. To the extent that any portion of the content reflects hypothetical results that were achieved by means of the retroactive application of a back-tested model, such results have inherent limitations, including:
Model results do not reflect the results of actual trading using assets, but were achieved by means of the retroactive application of the referenced models, certain aspects of which may have been designed with the benefit of hindsight
Back-tested performance may not reflect the impact that any material market or economic factors might have had on the use of a trading model if the model had been used during the period to actually manage assets
Actual investment results during the corresponding time periods may have been materially different from those portrayed in the model
Past performance may not be indicative of future results. Therefore, no one should assume that future performance will be profitable, or equal to any corresponding historical index.
The S&P 500 Composite Total Return Index (the "S&P") is a market capitalization-weighted index of 500 widely held stocks often used as a proxy for the stock market. Standard & Poor's chooses the member companies for the S&P based on market size, liquidity, and industry group representation. Included are the common stocks of industrial, financial, utility, and transportation companies. The S&P is not an index into which an investor can directly invest. The historical S&P performance results (and those of all other indices) are provided exclusively for comparison purposes only, so as to provide general comparative information to assist an individual in determining whether the performance of a specific portfolio or model meets, or continues to meet investment objective(s). The model and indices performance results do not reflect the impact of taxes.
Investing involves risk (even the “safe” kind)! Past performance does not guarantee or indicate future results. Different types of investments involve varying degrees of underlying risk. Therefore, do not assume that future performance of any specific investment or investment strategy be suitable for your portfolio or individual situation, will be profitable, equal any historical performance level(s), or prove successful (including the investments and/or investment strategies describe on this site).
Investing Process Links
Stabilize- Organize your $$$
- Manage your $$$
Plan
- Why You Invest
- Ways to Invest
- Where to Invest
- What to Invest In
Execute
- When to Invest
- How Much to Invest
- Buying & Selling
Monitor
- Track The Market
- Track Your Returns
Reflect & Adjust
- Improve Your Returns
- Adjust your Holdings
Popular Pages
- Jim Cramer- Personal Incomes Statements
- Hyperinflation
- Calculating Beta
- SMART Financial Goals
Blogroll
- Advisor Perspectives- Dividend Growth Investor
- Elliott Wave Lives On
- On My Radar | CMG Wealth
- Sure Dividend
- The Big Picture
- The Fat Pitch
- Thoughts from the Frontline
- Trader Feed
Sponsored Links
Invest Safely provides valuable, time-saving info about personal finance, money management, and investing.


