Stock Market Outlook
For The Week Of August 8th = Uptrend
INDICATORS
-
ADX Directional Indicators: Uptrend
Price & Volume Action: Mixed
Elliott Wave Analysis: Uptrend
Technically speaking, the S&P500 ($SPX) hasn’t advanced too much from July 26th or so; the index starts this week ~3% above the 50-day moving average, and >10% above the 200-day moving average.
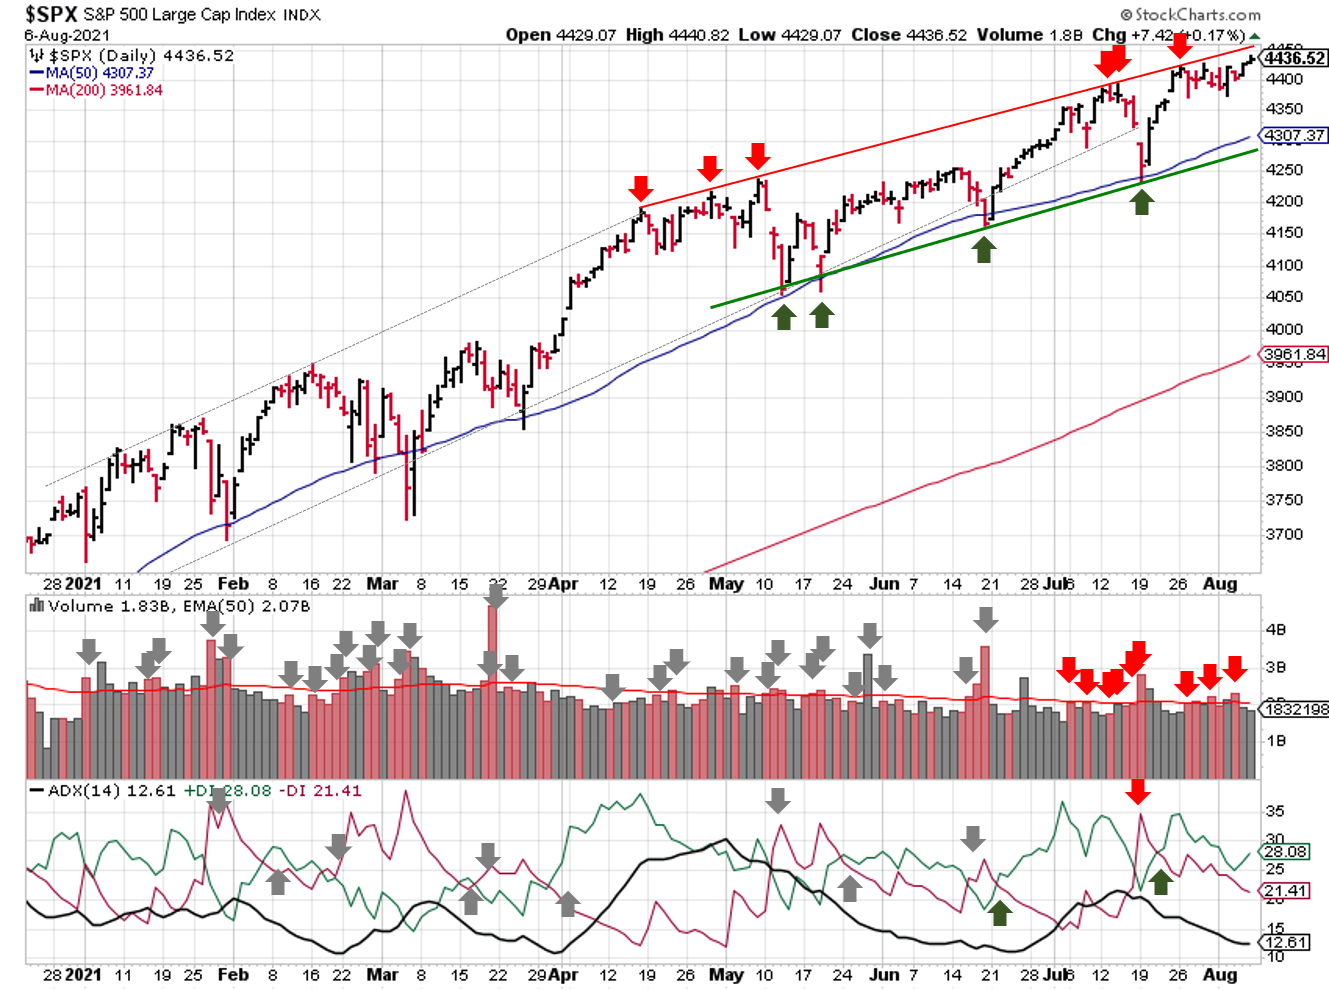
2021-08-08-SPX Trendline Analysis - Daily
The ADX remains bullish with weak overall price movement. The S&P also picked up another distribution day. The count remains elevated (9), so the signal remains mixed.
One the plus side, the cluster of 6 from early July isn’t too concerning at this point, since recent selling has been sporadic. Another cluster now would be a bigger problem.
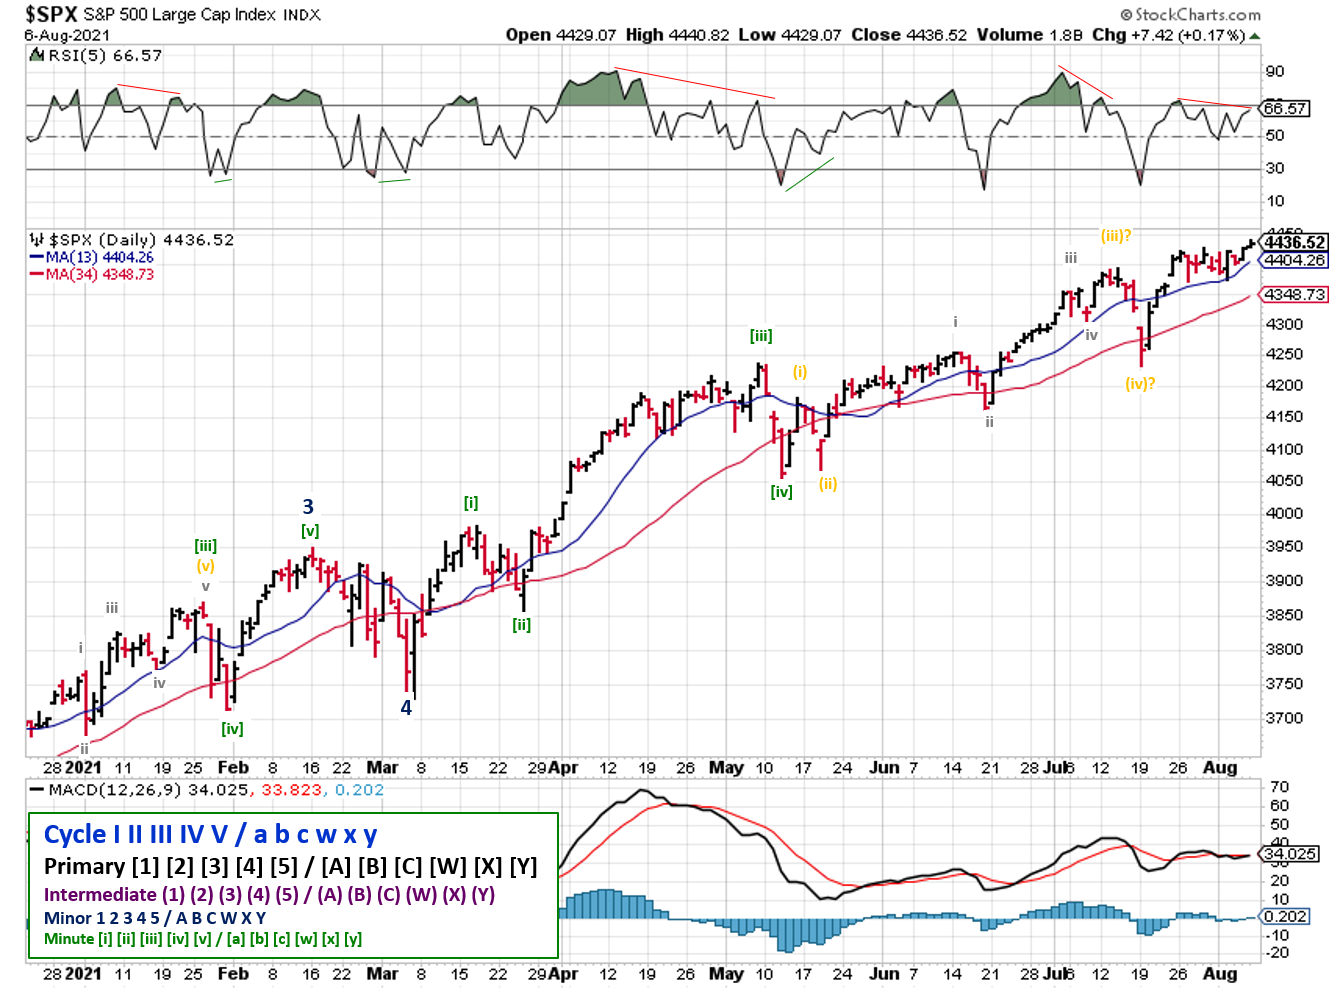
2021-08-08-SPX Elliott Wave Analysis - Daily - Primary 1
The uptrend signal from Elliott Wave remains in place.
COMMENTARY
Q2 earnings continue to come in on the strong side, but forward looking expectations (or lack thereof) seem to be scaring investors and causing sell-offs. Partly to blame are improving economic conditions; U.S. unemployment fell in July, and in response treasury yields fell.
Expect a lot of hyperventilating about the Fed, interest rates, inflation, and employment in the coming weeks, leading up to the Fed meeting in Jackson Hole next month. None of it will be really useful for your decision making.
Instead, take a step back and see the forest for the trees, and watch GDP and consumer spending.
We've had good economic growth, relatively low inflation, and falling unemployment with more jobs than employees some areas. The U.S. consumer continues to spend, thanks in part to government "funding".
Those conditions won't last forever. Economic growth will slow down, as we normalize pandemic-related shocks and learn to live with COVID.
We know that prices are increasing due to supply chain issues, and regardless of whether it's transitory, the Fed is going to allow inflation to increase. Plus, wages are rising (in an attempt to get people back to work), and that tends to be "sticky" (i.e. people don't like giving back raises).
Government stimulus will run out, and it's not clear if the U.S. consumer will continue to spend at the same level...especially if interest rates rise.
Put those things together and you've set the stage for stagflation: slowing economic growth (GDP) with rising inflation and high unemployment.
We don't have high unemployment, but employment is a proxy for the consumer demand (willingness to spend) and issues can occur even if it's relatively low (e.g. 1973).
During periods of stagflation, picking the right asset class/sector is critical. In terms of asset classes, commodities tend to be the biggest winners, while debt/credit based instruments struggle.
Stock and bond investors can still profit from growth strategies, but the sector becomes very important (e.g. is it rate sensitive?). For example, industrials, utilities, and big tech tend to outperform, while small caps and dividend plays tend to struggle.
For investors using an income investing strategy (specifically dividend investing), it's even more important to invest in companies that have weathered these storms before. To that end, here are to data sets for you to use:
- Dividend Growth Investor reviewed a subset of the Dividend Champions
- Companies that raised annual dividends each year for the past 25 years
- https://www.dividendgrowthinvestor.com/2021/08/44-dividend-champions-for-further.html
- Sure Dividend updated the list of Dividend King's last week
- Companies that raised annual dividends each year for the past 50 years
- https://www.suredividend.com/dividend-kings/
Best to Your Week!
If you find this research helpful, please tell a friend. If you don't find it helpful, tell an enemy.
I regularly share articles and other news of interest via on Twitter (@investsafely), Facebook, Linkedin, and Instagram (@investsafely)

How to Make Money in Stocks: A Winning System in Good Times and Bad.
It's one of my favorites.
Charts provided courtesy of stockcharts.com.
For historical Elliott Wave Analysis, go to ELLIOTT WAVE lives on by Tony Caldaro. Other interpretations can be found at: Pretzel Logic, and 12345ABCDEWXYZ
Once a year, I review the market outlook signals as if they were a mechanical trading system, while pointing out issues and making adjustments. The goal is to give you to give you an example of how to analyze and continuously improve your own systems.
- 2015 Performance - Stock Market Outlook
- 2016 Performance - Stock Market Outlook
- 2017 Performance - Stock Market Outlook
- 2018 Performance - Stock Market Outlook
- 2019 Performance - Stock Market Outlook
- 2020 Performance - Stock Market Outlook
IMPORTANT DISCLOSURE INFORMATION
This material is for general communication and is provided for informational and/or educational purposes only. None of the content should be viewed as a suggestion that you take or refrain from taking any action nor as a recommendation for any specific investment product, strategy, or other such purpose. Certain information contained herein has been obtained from third-party sources believed to be reliable, but we cannot guarantee its accuracy or completeness.
To the extent that a reader has any questions regarding the applicability of any specific issue discussed above to his/her individual situation, he/she is encouraged to consult with the professional advisors of his/her choosing. Invest Safely, LLC is not a law firm, certified public accounting firm, or registered investment advisor and no portion of its content should be construed as legal, accounting, or investment advice.
The material is not to be construed as an offer or a recommendation to buy or sell a security nor is it to be construed as investment advice. Additionally, the material accessible through this website does not constitute a representation that the investments described herein are suitable or appropriate for any person.
Hypothetical Presentations:
Any referenced performance is “as calculated” using the referenced funds and has not been independently verified. This presentation does not discuss, directly or indirectly, the amount of the profits or losses, realized or unrealized, by any reader or contributor, from any specific funds or securities.
The author and/or any reader may have experienced materially different performance based upon various factors during the corresponding time periods. To the extent that any portion of the content reflects hypothetical results that were achieved by means of the retroactive application of a back-tested model, such results have inherent limitations, including:
Model results do not reflect the results of actual trading using assets, but were achieved by means of the retroactive application of the referenced models, certain aspects of which may have been designed with the benefit of hindsight
Back-tested performance may not reflect the impact that any material market or economic factors might have had on the use of a trading model if the model had been used during the period to actually manage assets
Actual investment results during the corresponding time periods may have been materially different from those portrayed in the model
Past performance may not be indicative of future results. Therefore, no one should assume that future performance will be profitable, or equal to any corresponding historical index.
The S&P 500 Composite Total Return Index (the "S&P") is a market capitalization-weighted index of 500 widely held stocks often used as a proxy for the stock market. Standard & Poor's chooses the member companies for the S&P based on market size, liquidity, and industry group representation. Included are the common stocks of industrial, financial, utility, and transportation companies. The S&P is not an index into which an investor can directly invest. The historical S&P performance results (and those of all other indices) are provided exclusively for comparison purposes only, so as to provide general comparative information to assist an individual in determining whether the performance of a specific portfolio or model meets, or continues to meet investment objective(s). The model and indices performance results do not reflect the impact of taxes.
Investing involves risk (even the “safe” kind)! Past performance does not guarantee or indicate future results. Different types of investments involve varying degrees of underlying risk. Therefore, do not assume that future performance of any specific investment or investment strategy be suitable for your portfolio or individual situation, will be profitable, equal any historical performance level(s), or prove successful (including the investments and/or investment strategies describe on this site).
Investing Process Links
Stabilize- Organize your $$$
- Manage your $$$
Plan
- Why You Invest
- Ways to Invest
- Where to Invest
- What to Invest In
Execute
- When to Invest
- How Much to Invest
- Buying & Selling
Monitor
- Track The Market
- Track Your Returns
Reflect & Adjust
- Improve Your Returns
- Adjust your Holdings
Popular Pages
- Jim Cramer- Personal Incomes Statements
- Hyperinflation
- Calculating Beta
- SMART Financial Goals
Blogroll
- Advisor Perspectives- Dividend Growth Investor
- Elliott Wave Lives On
- On My Radar | CMG Wealth
- Sure Dividend
- The Big Picture
- The Fat Pitch
- Thoughts from the Frontline
- Trader Feed
Sponsored Links
Invest Safely provides valuable, time-saving info about personal finance, money management, and investing.


