Stock Market Outlook
For The Week Of May 16th = Uptrend
INDICATORS
-
ADX Directional Indicators: Downtrend
Price & Volume Action: Mixed
Elliott Wave Analysis: Uptrend
A mixed bag last week, with the S&P500 ($SPX) selling-off on inflation concerns, and then attempting a recovery rally to close out the week.
The index is a few points away from closing the price gap created by Tuesday’s opening. We'll have to see if that event leads to another leg down in price (one possible outcome based on Elliott Wave).
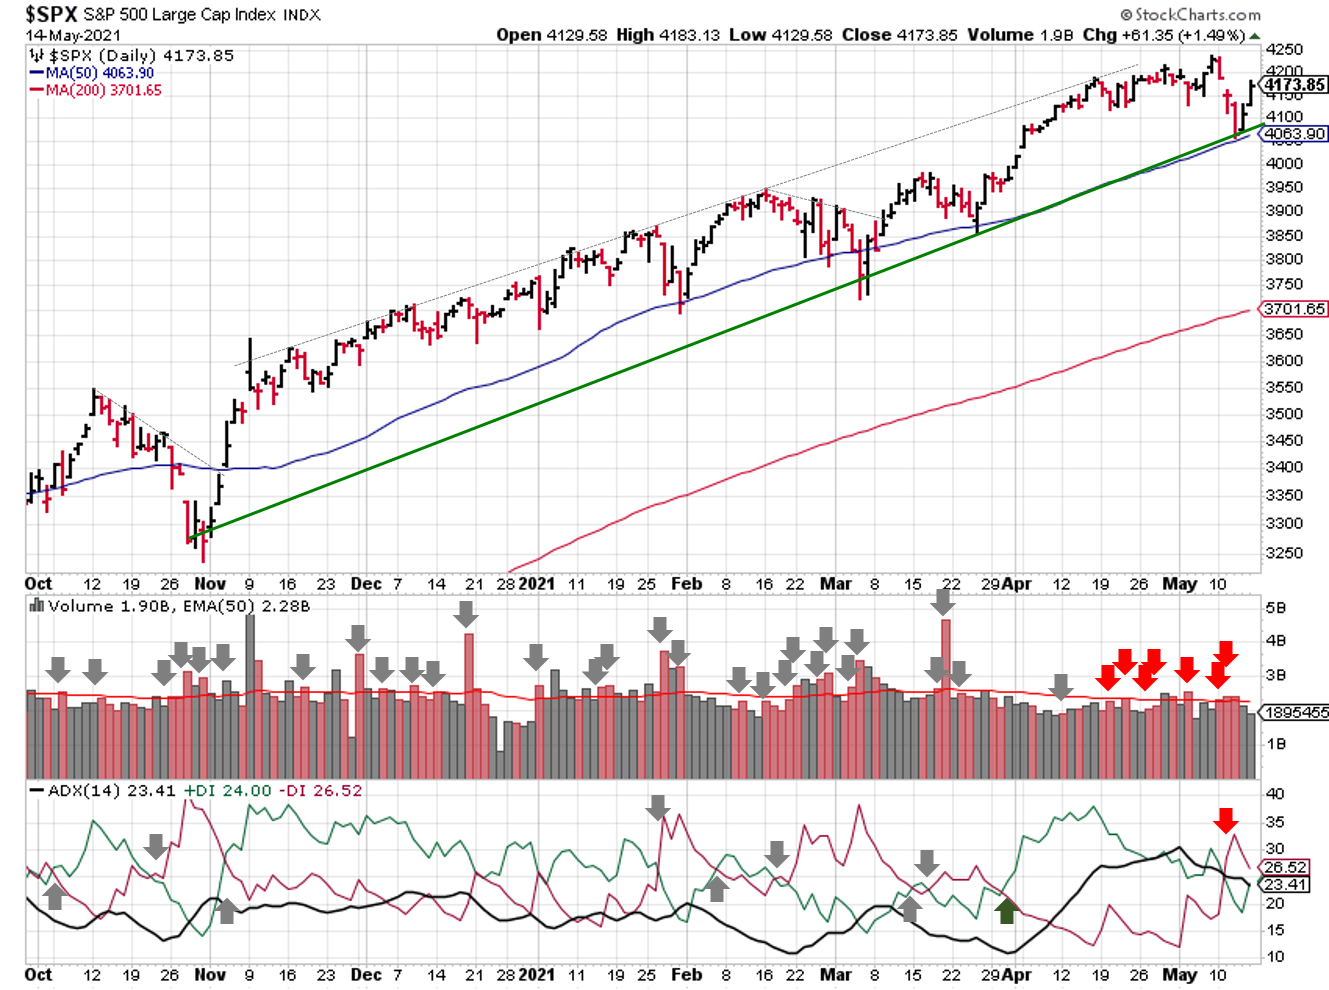
2021-05-16-SPX Trendline Analysis - Daily
The ADX flipped to a bearish trend early last week, but could recover shortly if Thursday/Friday trading continues.
The S&P500 picked up another distribution day, putting the count at 7 and shifting the price/volume signal to mixed (since price is still above the 50-day moving average).
The lack of trading volume on upside days continues to indicate a buy-the-dip mentality. It’s a good sign that people are still willing to buy, even at these elevated valuations. But that also means they need dips to buy, and may leave investors out in the cold when that strategy no longer works.
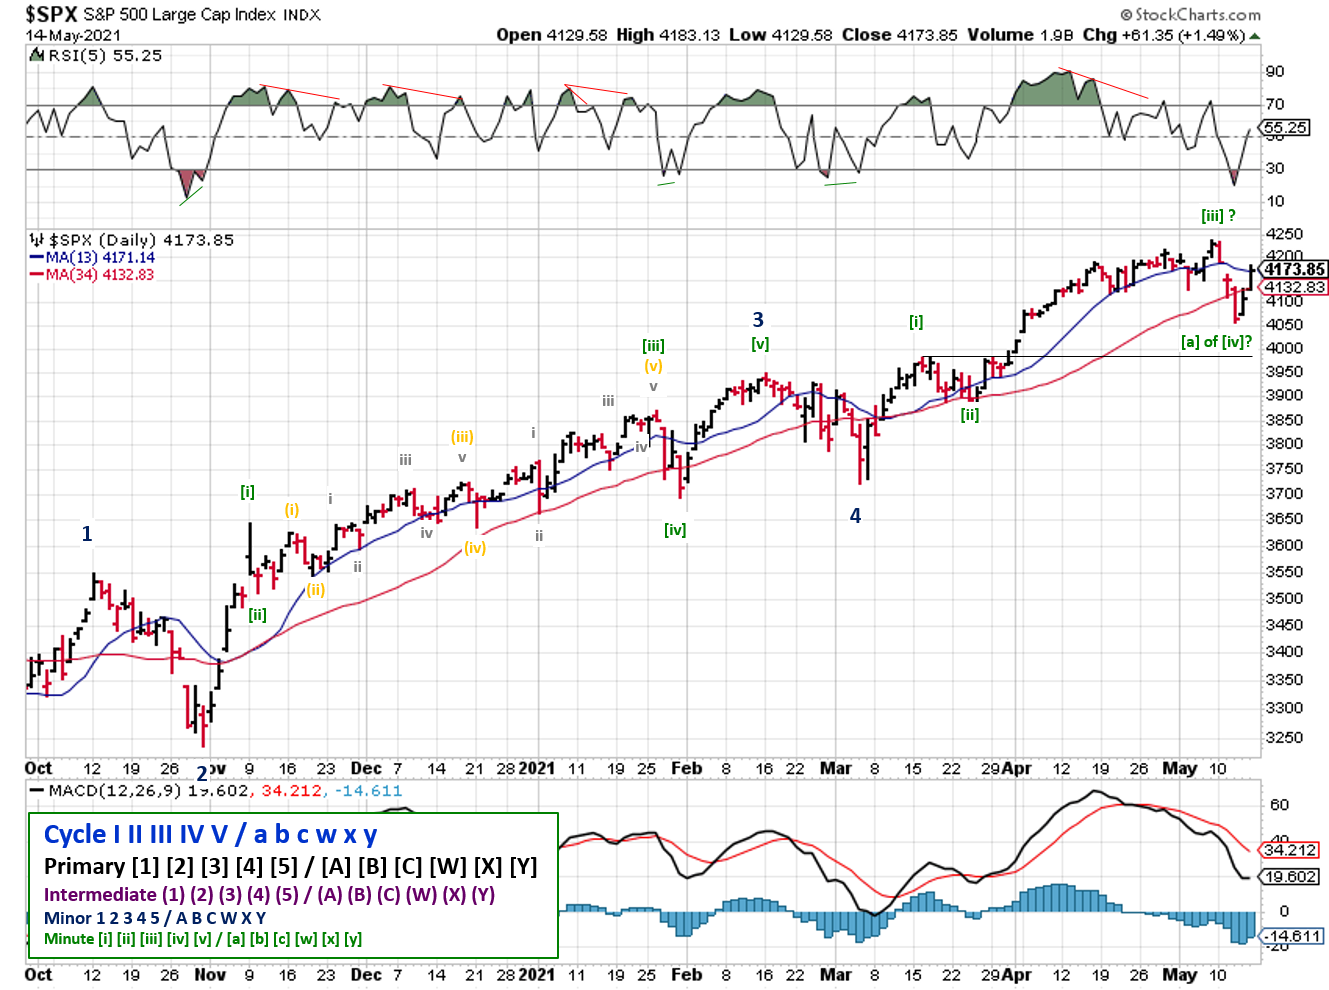
2021-05-16-SPX Elliott Wave Analysis - Daily - Primary 1
For Elliott Wave, calls for the completion of a 4th wave may have been a bit pre-mature. That, or we completed a 5th wave and it's all downhill from here (!). The daily chart looks like it's in the b-wave of a corrective zigzag. Until we reach a new high or close below 3981, the 4th wave remains in play .
COMMENTARY
The SPAC space has been decimated over the past few weeks, and most technology-related companies aren't far behind. It's so bad that the talking heads are starting to hedge their messaging, telling investors to lower their return expectations, look for "value" , and consider cyclical industries and international exposure.
On the heel's of the disappointing jobs report, CPI data came in hot. And that's even after sandbagging by removing food and energy, which everyone knows are getting more expensive and are a pretty big deal when it comes to the personal finances of individual investors.
As expected, the Fed continues to say that the increase was expected based on all things related to the pandemic, and is likely to be transitory in nature. Human beings are transitory too, if you make the time frame long enough...
#Transitory pic.twitter.com/9lUpVSd6o0
— Invest-Safely.com (@investsafely) May 12, 2021
Best to Your Week!
If you find this research helpful, please tell a friend. If you don't find it helpful, tell an enemy.
I regularly share articles and other news of interest via on Twitter (@investsafely), Facebook, Linkedin, and Instagram (@investsafely)

How to Make Money in Stocks: A Winning System in Good Times and Bad.
It's one of my favorites.
Charts provided courtesy of stockcharts.com.
For historical Elliott Wave Analysis, go to ELLIOTT WAVE lives on by Tony Caldaro. Other interpretations can be found at: Pretzel Logic, and 12345ABCDEWXYZ
Once a year, I review the market outlook signals as if they were a mechanical trading system, while pointing out issues and making adjustments. The goal is to give you to give you an example of how to analyze and continuously improve your own systems.
- 2015 Performance - Stock Market Outlook
- 2016 Performance - Stock Market Outlook
- 2017 Performance - Stock Market Outlook
- 2018 Performance - Stock Market Outlook
- 2019 Performance - Stock Market Outlook
- 2020 Performance - Stock Market Outlook
IMPORTANT DISCLOSURE INFORMATION
This material is for general communication and is provided for informational and/or educational purposes only. None of the content should be viewed as a suggestion that you take or refrain from taking any action nor as a recommendation for any specific investment product, strategy, or other such purpose. Certain information contained herein has been obtained from third-party sources believed to be reliable, but we cannot guarantee its accuracy or completeness.
To the extent that a reader has any questions regarding the applicability of any specific issue discussed above to his/her individual situation, he/she is encouraged to consult with the professional advisors of his/her choosing. Invest Safely, LLC is not a law firm, certified public accounting firm, or registered investment advisor and no portion of its content should be construed as legal, accounting, or investment advice.
The material is not to be construed as an offer or a recommendation to buy or sell a security nor is it to be construed as investment advice. Additionally, the material accessible through this website does not constitute a representation that the investments described herein are suitable or appropriate for any person.
Hypothetical Presentations:
Any referenced performance is “as calculated” using the referenced funds and has not been independently verified. This presentation does not discuss, directly or indirectly, the amount of the profits or losses, realized or unrealized, by any reader or contributor, from any specific funds or securities.
The author and/or any reader may have experienced materially different performance based upon various factors during the corresponding time periods. To the extent that any portion of the content reflects hypothetical results that were achieved by means of the retroactive application of a back-tested model, such results have inherent limitations, including:
Model results do not reflect the results of actual trading using assets, but were achieved by means of the retroactive application of the referenced models, certain aspects of which may have been designed with the benefit of hindsight
Back-tested performance may not reflect the impact that any material market or economic factors might have had on the use of a trading model if the model had been used during the period to actually manage assets
Actual investment results during the corresponding time periods may have been materially different from those portrayed in the model
Past performance may not be indicative of future results. Therefore, no one should assume that future performance will be profitable, or equal to any corresponding historical index.
The S&P 500 Composite Total Return Index (the "S&P") is a market capitalization-weighted index of 500 widely held stocks often used as a proxy for the stock market. Standard & Poor's chooses the member companies for the S&P based on market size, liquidity, and industry group representation. Included are the common stocks of industrial, financial, utility, and transportation companies. The S&P is not an index into which an investor can directly invest. The historical S&P performance results (and those of all other indices) are provided exclusively for comparison purposes only, so as to provide general comparative information to assist an individual in determining whether the performance of a specific portfolio or model meets, or continues to meet investment objective(s). The model and indices performance results do not reflect the impact of taxes.
Investing involves risk (even the “safe” kind)! Past performance does not guarantee or indicate future results. Different types of investments involve varying degrees of underlying risk. Therefore, do not assume that future performance of any specific investment or investment strategy be suitable for your portfolio or individual situation, will be profitable, equal any historical performance level(s), or prove successful (including the investments and/or investment strategies describe on this site).
Investing Process Links
Stabilize- Organize your $$$
- Manage your $$$
Plan
- Why You Invest
- Ways to Invest
- Where to Invest
- What to Invest In
Execute
- When to Invest
- How Much to Invest
- Buying & Selling
Monitor
- Track The Market
- Track Your Returns
Reflect & Adjust
- Improve Your Returns
- Adjust your Holdings
Popular Pages
- Jim Cramer- Personal Incomes Statements
- Hyperinflation
- Calculating Beta
- SMART Financial Goals
Blogroll
- Advisor Perspectives- Dividend Growth Investor
- Elliott Wave Lives On
- On My Radar | CMG Wealth
- Sure Dividend
- The Big Picture
- The Fat Pitch
- Thoughts from the Frontline
- Trader Feed
Sponsored Links
Invest Safely provides valuable, time-saving info about personal finance, money management, and investing.


