Stock Market Outlook
For The Week Of April 4th = Uptrend
INDICATORS
-
ADX Directional Indicators: Uptrend
Price & Volume Action: Uptrend
Elliott Wave Analysis: Uptrend
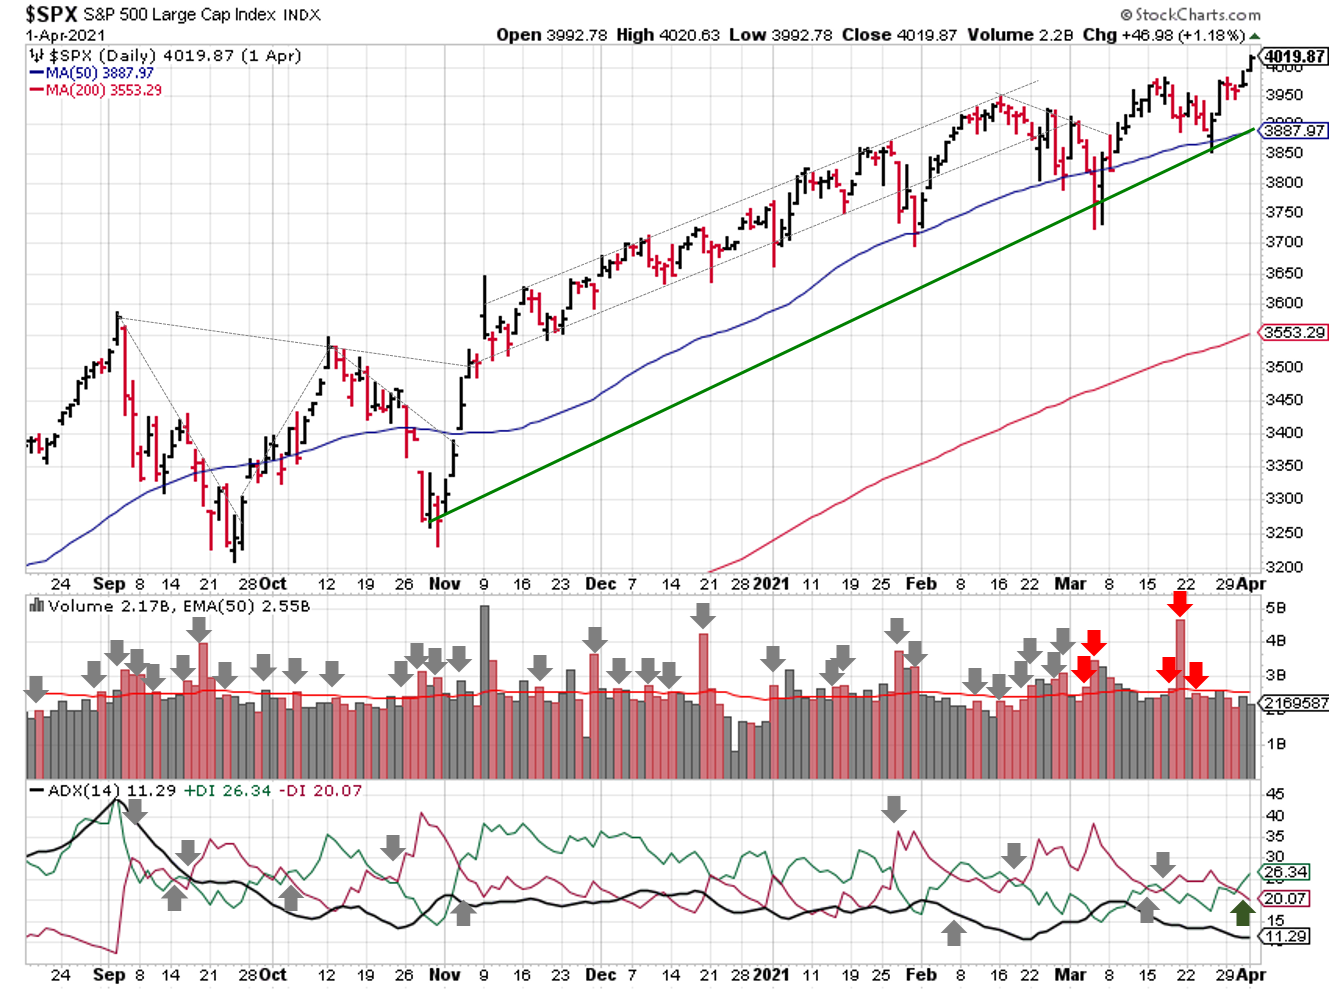
2021-04-04-SPX Trendline Analysis - Daily
The S&P500 ($SPX) ended the shortened trading week higher, crossing 4000 for the first time ever. The ADX finally joined the other signals in bullish territory, and 3 distribution days fell off the count.
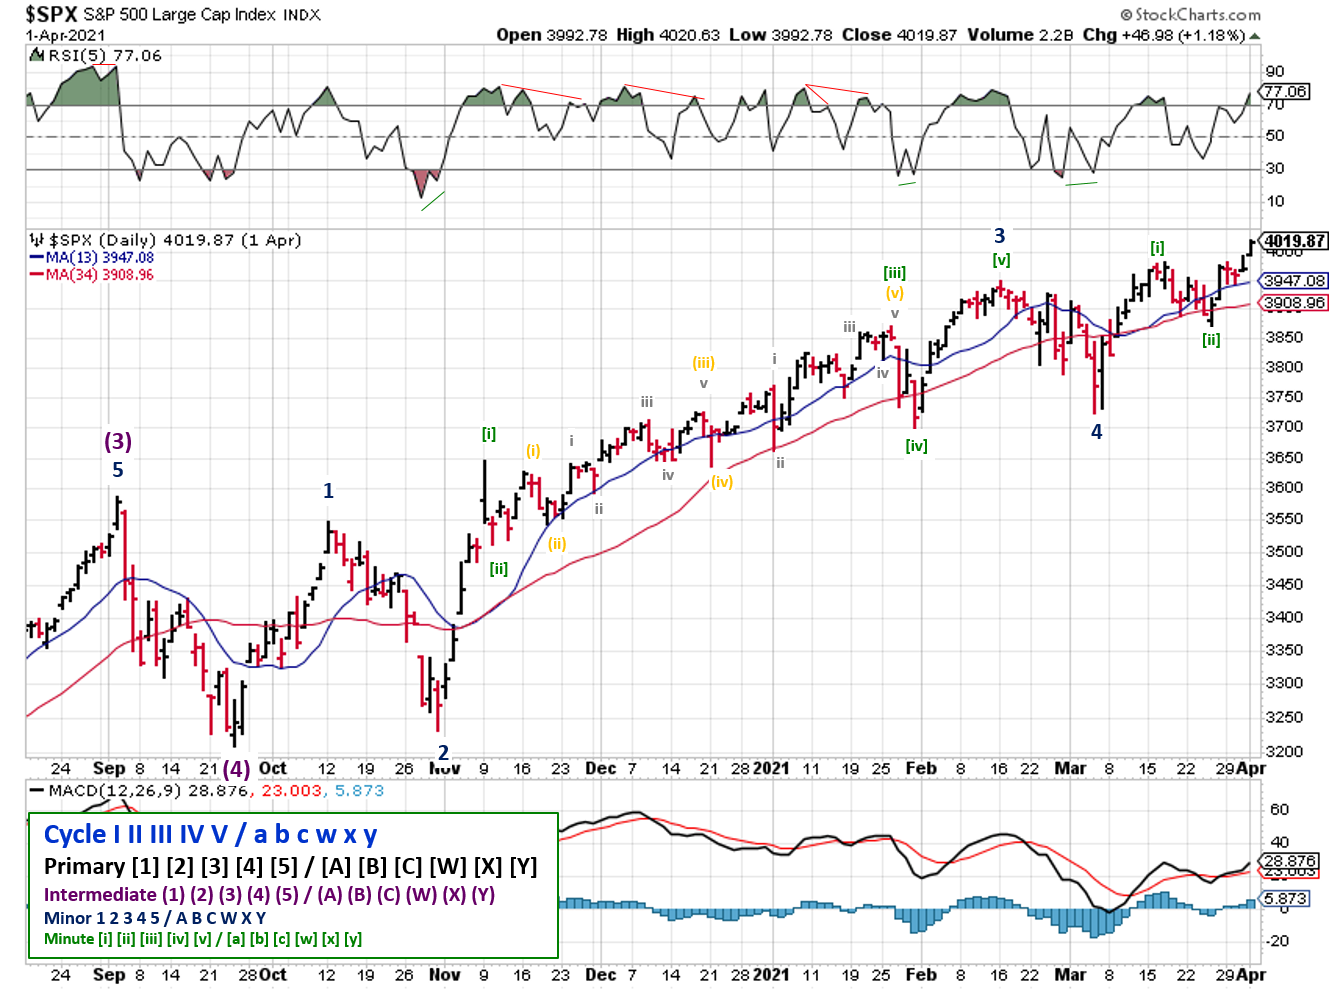
2021-03-28-SPX Elliott Wave Analysis - Daily - Primary 1
The Elliott Wave count remains the same as last week, showing the S&P in the third wave of a Minor 5.
COMMENTARY
Last week, the Biden administration unveiled the "American Jobs Plan", proposing $2+ trillion in new spending over the next 8 years, including:
- $620 billion for transportation infrastructure (roads, bridges, transit, electric vehicles)
- $400 billion for domestic manufacturing and workforce development
- $400 billion for disability/elderly care programs
- $300 billion for housing
- $200 billion for expanded broadband and electrical grid improvements
- $180 billion in research and development focused on clean energy
Our infrastructure could use the help for sure, so this package could do a lot of good if handled correctly (i.e. real improvements are made rather than pork barrel spending and pet projects).
The goal is to make the spending "revenue-neutral", which is another way of saying tax hikes. Right now, that would be increased corporate taxes. Not quite as high as they were prior to the Trump administrations tax cuts, and still near all time lows, but an increase either way. The last round of cuts were largely absorbed via increased dividends and share buy-backs, so it's not clear how the increases will be addressed.
Best to Your Week!
If you find this research helpful, please tell a friend. If you don't find it helpful, tell an enemy.
I regularly share articles and other news of interest via on Twitter (@investsafely), Facebook, Linkedin, and Instagram (@investsafely)

How to Make Money in Stocks: A Winning System in Good Times and Bad.
It's one of my favorites.
Charts provided courtesy of stockcharts.com.
For historical Elliott Wave Analysis, go to ELLIOTT WAVE lives on by Tony Caldaro. Other interpretations can be found at: Pretzel Logic, and 12345ABCDEWXYZ
Once a year, I review the market outlook signals as if they were a mechanical trading system, while pointing out issues and making adjustments. The goal is to give you to give you an example of how to analyze and continuously improve your own systems.
- 2015 Performance - Stock Market Outlook
- 2016 Performance - Stock Market Outlook
- 2017 Performance - Stock Market Outlook
- 2018 Performance - Stock Market Outlook
- 2019 Performance - Stock Market Outlook
- 2020 Performance - Stock Market Outlook
IMPORTANT DISCLOSURE INFORMATION
This material is for general communication and is provided for informational and/or educational purposes only. None of the content should be viewed as a suggestion that you take or refrain from taking any action nor as a recommendation for any specific investment product, strategy, or other such purpose. Certain information contained herein has been obtained from third-party sources believed to be reliable, but we cannot guarantee its accuracy or completeness.
To the extent that a reader has any questions regarding the applicability of any specific issue discussed above to his/her individual situation, he/she is encouraged to consult with the professional advisors of his/her choosing. Invest Safely, LLC is not a law firm, certified public accounting firm, or registered investment advisor and no portion of its content should be construed as legal, accounting, or investment advice.
The material is not to be construed as an offer or a recommendation to buy or sell a security nor is it to be construed as investment advice. Additionally, the material accessible through this website does not constitute a representation that the investments described herein are suitable or appropriate for any person.
Hypothetical Presentations:
Any referenced performance is “as calculated” using the referenced funds and has not been independently verified. This presentation does not discuss, directly or indirectly, the amount of the profits or losses, realized or unrealized, by any reader or contributor, from any specific funds or securities.
The author and/or any reader may have experienced materially different performance based upon various factors during the corresponding time periods. To the extent that any portion of the content reflects hypothetical results that were achieved by means of the retroactive application of a back-tested model, such results have inherent limitations, including:
Model results do not reflect the results of actual trading using assets, but were achieved by means of the retroactive application of the referenced models, certain aspects of which may have been designed with the benefit of hindsight
Back-tested performance may not reflect the impact that any material market or economic factors might have had on the use of a trading model if the model had been used during the period to actually manage assets
Actual investment results during the corresponding time periods may have been materially different from those portrayed in the model
Past performance may not be indicative of future results. Therefore, no one should assume that future performance will be profitable, or equal to any corresponding historical index.
The S&P 500 Composite Total Return Index (the "S&P") is a market capitalization-weighted index of 500 widely held stocks often used as a proxy for the stock market. Standard & Poor's chooses the member companies for the S&P based on market size, liquidity, and industry group representation. Included are the common stocks of industrial, financial, utility, and transportation companies. The S&P is not an index into which an investor can directly invest. The historical S&P performance results (and those of all other indices) are provided exclusively for comparison purposes only, so as to provide general comparative information to assist an individual in determining whether the performance of a specific portfolio or model meets, or continues to meet investment objective(s). The model and indices performance results do not reflect the impact of taxes.
Investing involves risk (even the “safe” kind)! Past performance does not guarantee or indicate future results. Different types of investments involve varying degrees of underlying risk. Therefore, do not assume that future performance of any specific investment or investment strategy be suitable for your portfolio or individual situation, will be profitable, equal any historical performance level(s), or prove successful (including the investments and/or investment strategies describe on this site).
Investing Process Links
Stabilize- Organize your $$$
- Manage your $$$
Plan
- Why You Invest
- Ways to Invest
- Where to Invest
- What to Invest In
Execute
- When to Invest
- How Much to Invest
- Buying & Selling
Monitor
- Track The Market
- Track Your Returns
Reflect & Adjust
- Improve Your Returns
- Adjust your Holdings
Popular Pages
- Jim Cramer- Personal Incomes Statements
- Hyperinflation
- Calculating Beta
- SMART Financial Goals
Blogroll
- Advisor Perspectives- Dividend Growth Investor
- Elliott Wave Lives On
- On My Radar | CMG Wealth
- Sure Dividend
- The Big Picture
- The Fat Pitch
- Thoughts from the Frontline
- Trader Feed
Sponsored Links
Invest Safely provides valuable, time-saving info about personal finance, money management, and investing.


