Stock Market Outlook
For The Week Of August 30th = Uptrend
INDICATORS
-
ADX Directional Indicators: Uptrend
Price & Volume Action: Uptrend
Elliott Wave Analysis: Uptrend
The stock market outlook remains in an uptrend heading into the week, with bullish trends in place for the ADX, price/volume, and Elliott Wave.
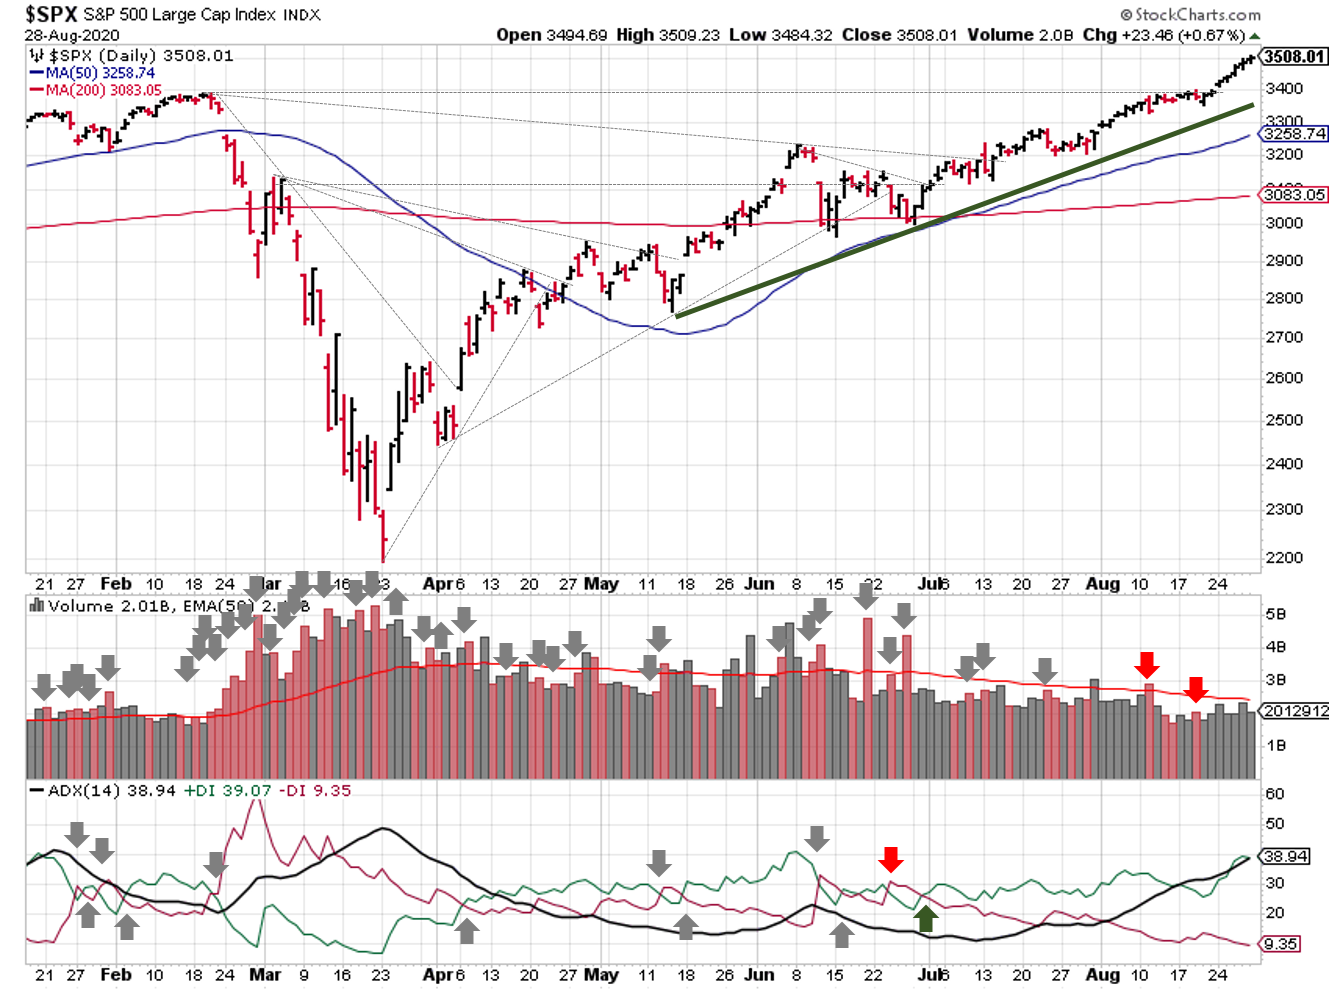
2020-08-30-SPX Trendline Analysis - Daily
The S&P500 ($SPX) now sits ~12% above the 200-day; odds still favor sideways or downward price action near-term. But the first technical support level would be the May to June trendline.
The ADX shows a strong bullish trend in place, and price/volume action has also been bullish. The "correct" Elliott Wave count isn't clear (to me at least). I adjusted the wave labeling, but all I really know is that it hasn't turned bearish yet, so it's still risk on.

2020-08-30-SPX Elliott Wave Analysis - Daily - Intermediate C
Considering the current rally has retraced the entire downtrend and price is sitting at all time highs, it's possible the S&P will reach a Fibonacci extension target before another correction. For example:
- 114.6% of the prior downtrend = 1377 points = 3,568 (~2% from Friday's close)
- 123.6% of the prior downtrend = 1485 points = 3,676 (~5% from Friday's close)
- 132.8% of the prior downtrend = 1596 points = 3,787 (~8% from Friday's close)
- 161.8% of the prior downtrend = 1944 points = 4,135 (~18% from Friday's close)
The RSI may not be showing a divergence anymore, but now it's extremely overbought; pick your poison.
COMMENTARY
Earnings season is wrapping up, with most companies reported better than expected earnings in Q2. Definitely the right direction, but definitely not an all clear. You may have also heard that some heavyweights of the Dow Jones index (Exxon Mobil, Pfizer, and Raytheon) will be replaced September 1st by Amgen, Honeywell, and Salesforce.
More importantly, the Fed held their annual meeting in Jackson Hole, Wyoming, which included a major change in the way inflation will be viewed in the years ahead.
Basically, the Fed doesn't want deflation. They're so scared of it that they're willing to let inflation run higher than their 2% target if inflation is below that target for too long...like it has been...for the past 10 years...despite the Fed's use of record low interest rates and massive lending programs (the Fed can lend, but not spend...at least right now).
Near term, that probably won't change much...interest rates and inflation have both been low for a while now. And now we know rates won't change even when we do finally see inflation.
This creates issues for investors and their asset allocation strategies. Stocks will outperform with rates near zero, because they're basically the only game in town if you want a return. Investors have also piled into bonds, because any return is better than no return or a loss. But when we eventually do see sustained inflation over and above the target, one or two quarter point rate hikes aren't going to cut it. And that's going to shock the system.
Bonds lose value when rates rise...great for investors looking to buy, but not so good for those who need to sell. Rising rates aren't usually good for stocks because the cost of doing business (raw materials, corporate debt, wages, etc.) are higher.
From a personal finance perspective, this is a troubling development too.
Think back to a time when you got a "cost of living" raise at work; this was meant to compensate for increased expenses due to inflation. Rudy Havenstein tweeted “When you see the word ‘inflation,’ replace it with the phrase ‘the cost of living' and see if you like what you hear". When we do finally see inflation, expect you're expenses to increase more for a longer period time.
And +2% inflation is already here...it's just not evenly distributed. How you personally experience it is totally dependent on your expenses. Have a lot of housing, health care, education, or energy expenses? Then you know what I'm talking about. Letting average inflation run higher than 2% will likely mean those expenses increase even more in the coming years!
And since the Fed calculates inflation based on a bunch of different expenses, that distribution is even more lumpy. Let's say the your meal/pet toy/clothes subscription box goes from 25 to 30 bucks a month (for example). $5 may not seem like a big deal, but that's 20% inflation! At the same time, your new OLED TV probably goes from $799 to $749. Average those two expenses together, and the net inflation is actually <1%; if those two expenses were the "basket of expenses" the Fed uses to calculate inflation, they would say that we need to continue with lower interest rates because we're below target.
It's not all bad though. We all still have time to prepare, do research, make a plan. Some jobs will command much higher salaries. You'll actually be able to get a decent return from a savings account! And all the money that central banks have and will unleash has to go somewhere. Where will that money flow? Bonds? Gold? Crypto? TIPS?
Best to your week!
If you find this research helpful, please tell a friend. If you don't find it helpful, tell an enemy.
I regularly share articles and other news of interest via on Twitter (@investsafely), Facebook, Linkedin, and Instagram (@investsafely)
If you're interested in learning more about the relationship between price and volume, or how to find and trade the best stocks for your growth strategy, check out this book on Amazon via the following affiliate link:

How to Make Money in Stocks: A Winning System in Good Times and Bad.
It's one of my favorites.
Charts provided courtesy of stockcharts.com.
For the detailed Elliott Wave Analysis, go to the ELLIOTT WAVE lives on by Tony Caldaro.
Once a year, I review the market outlook signals as if they were a mechanical trading system, while pointing out issues and making adjustments. The goal is to give you to give you an example of how to analyze and continuously improve your own systems.
- 2015 Performance - Stock Market Outlook
- 2016 Performance - Stock Market Outlook
- 2017 Performance - Stock Market Outlook
- 2018 Performance - Stock Market Outlook
- 2019 Performance - Stock Market Outlook
IMPORTANT DISCLOSURE INFORMATION
This material is for general communication and is provided for informational and/or educational purposes only. None of the content should be viewed as a suggestion that you take or refrain from taking any action nor as a recommendation for any specific investment product, strategy, or other such purpose. Certain information contained herein has been obtained from third-party sources believed to be reliable, but we cannot guarantee its accuracy or completeness.
To the extent that a reader has any questions regarding the applicability of any specific issue discussed above to his/her individual situation, he/she is encouraged to consult with the professional advisors of his/her choosing. Invest Safely, LLC is not a law firm, certified public accounting firm, or registered investment advisor and no portion of its content should be construed as legal, accounting, or investment advice.
The material is not to be construed as an offer or a recommendation to buy or sell a security nor is it to be construed as investment advice. Additionally, the material accessible through this website does not constitute a representation that the investments described herein are suitable or appropriate for any person.
Hypothetical Presentations:
Any referenced performance is “as calculated” using the referenced funds and has not been independently verified. This presentation does not discuss, directly or indirectly, the amount of the profits or losses, realized or unrealized, by any reader or contributor, from any specific funds or securities.
The author and/or any reader may have experienced materially different performance based upon various factors during the corresponding time periods. To the extent that any portion of the content reflects hypothetical results that were achieved by means of the retroactive application of a back-tested model, such results have inherent limitations, including:
Model results do not reflect the results of actual trading using assets, but were achieved by means of the retroactive application of the referenced models, certain aspects of which may have been designed with the benefit of hindsight
Back-tested performance may not reflect the impact that any material market or economic factors might have had on the use of a trading model if the model had been used during the period to actually manage assets
Actual investment results during the corresponding time periods may have been materially different from those portrayed in the model
Past performance may not be indicative of future results. Therefore, no one should assume that future performance will be profitable, or equal to any corresponding historical index.
The S&P 500 Composite Total Return Index (the "S&P") is a market capitalization-weighted index of 500 widely held stocks often used as a proxy for the stock market. Standard & Poor's chooses the member companies for the S&P based on market size, liquidity, and industry group representation. Included are the common stocks of industrial, financial, utility, and transportation companies. The S&P is not an index into which an investor can directly invest. The historical S&P performance results (and those of all other indices) are provided exclusively for comparison purposes only, so as to provide general comparative information to assist an individual in determining whether the performance of a specific portfolio or model meets, or continues to meet investment objective(s). The model and indices performance results do not reflect the impact of taxes.
Investing involves risk (even the “safe” kind)! Past performance does not guarantee or indicate future results. Different types of investments involve varying degrees of underlying risk. Therefore, do not assume that future performance of any specific investment or investment strategy be suitable for your portfolio or individual situation, will be profitable, equal any historical performance level(s), or prove successful (including the investments and/or investment strategies describe on this site).
Popular Pages
- Jim Cramer- Personal Incomes Statements
- Hyperinflation
- Calculating Beta
- SMART Financial Goals
Blogroll
- Advisor Perspectives- Dividend Growth Investor
- Elliott Wave Lives On
- On My Radar | CMG Wealth
- Sure Dividend
- The Big Picture
- The Fat Pitch
- Thoughts from the Frontline
- Trader Feed
Sponsored Links
Invest Safely provides valuable, time-saving info about personal finance, money management, and investing.


