Weekend Stock Market Outlook
Stock Market Outlook For The Week of
March 29th = Downtrend
INDICATORS
ADX Directional Indicators: Downtrend
Price & Volume Action: Downtrend
Objective Elliott Wave Analysis: Downtrend
The stock market outlook remains in a downtrend; no change in the ADX, price/volume, or Elliott Wave.
The ADX directional indicators narrowed last week on a near-term bottom in price. Another week like that and we could see an uptrend signal. The same goes for price/volume. For Elliott Wave, I've seen bullish and bearish counts mixed with bull and bear market calls. Bulls say the bottom is in, the recession is priced in, and this rally leads back to new highs. Bears say the rally is bull trap, short-covering, etc. before the next sell-off begins.

2020-03-29 - SPX Trendline Analysis - Daily
Technically speaking, the S&P500 ($SPX) sits ~16% below the 50 and 200 day moving average, which are about to cross-over. First things first, the S&P will need to break through the current downward trendline. The index also put in a potential rally start on Tuesday, so we'll be looking for a follow-through day starting this week. That said, severe market corrections like this one aren't kind to the first rally attempt; most fail.
Longer term, you can see how far and fast prices fell, and where we are in relation to the 2016 low.
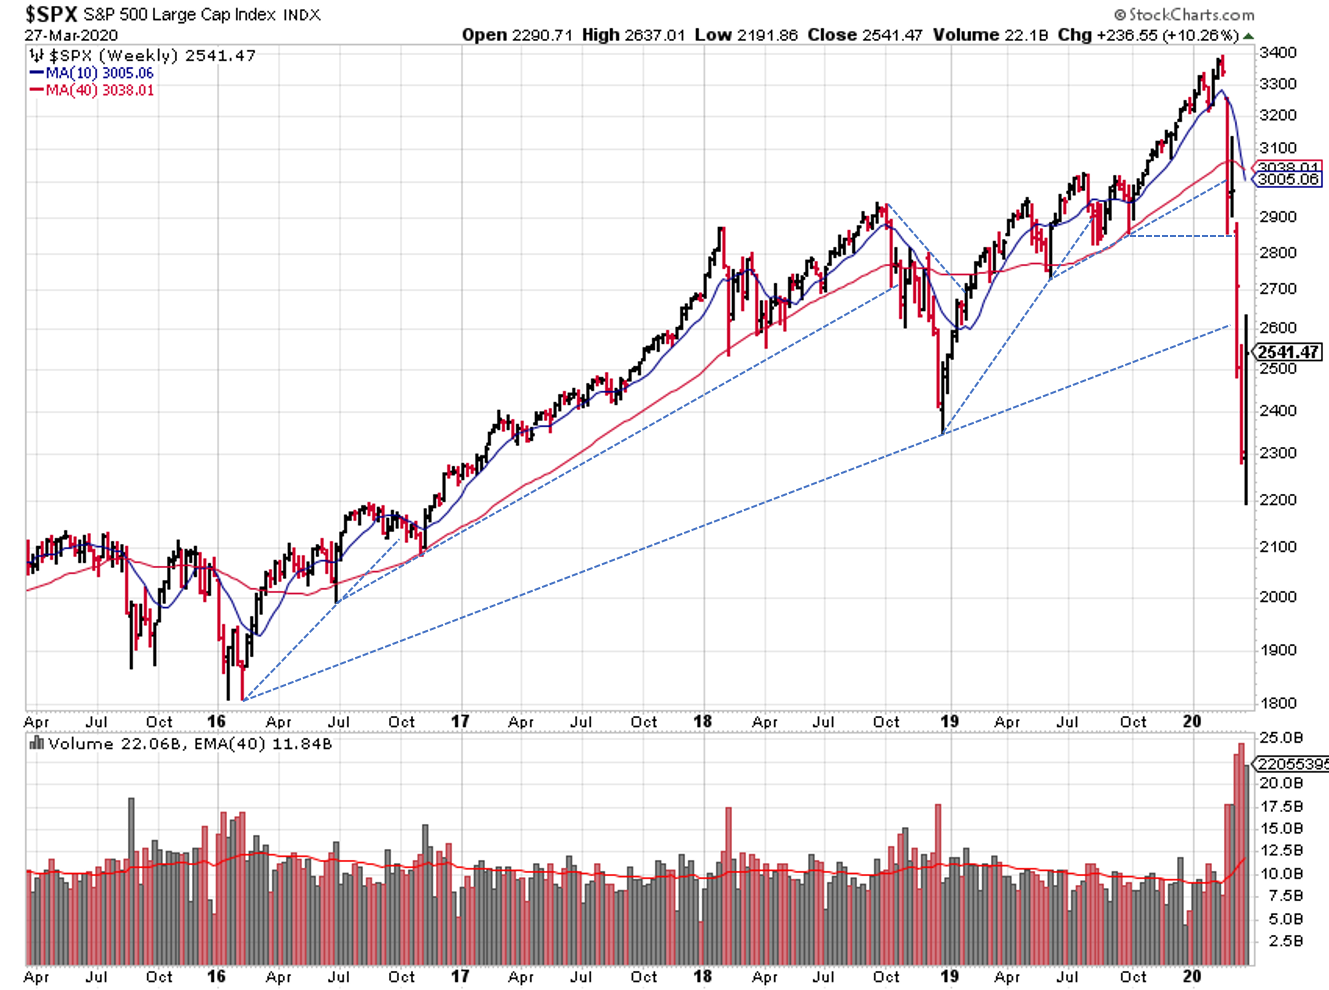
2020-03-29 - SPX Trendline Analysis - Weekly
From an economic standpoint, last week was extraordinary.
- The Fed, in coordination with the U.S. treasury, announced several programs to ensure liquidity for investors, employers, consumers, businesses and governments.
- The US government (finally) agreed to a $2 trillion stimulus package, including the fabled helicopter money that was discussed back in 2008.
- Initial jobless report came in at 3.3 million new unemployment claims! Before last week, 700,000 was the highest weekly total in history.
And through it all, U.S. stocks saw their best week in 11 years, posting back-to-back up days for the first time in over a month! We were overdue for a rally of some kind...after such a steep correction, every kind of investor, big or small, needed to make adjustments.
But before we get carried away, remember that stocks are essentially "fair value" right now. We're about 25% below the February peak, and stock prices are basically "even" from a valuation perspective. It's from that starting point that we head into earnings season. And some firms are already withdrawing their earnings guidance for the year, making it even hard to figure out the right price going forward. Wall street analysts will do their best, but at this point, we're all just speculators.
In my opinion, the bottom is NOT in. I don't know how long or how high the rally will go. I do know that people are being hit in paycheck, whether that's from lay-offs, reduced hours, pay cuts, or even super low interest rates, bond yields, and dividend cuts. Quarantines, shutdowns, shelter in place, and social distancing measures are changing spending habits, at least in the near term. We'll see more businesses close their doors; some temporarily, others for good. Unemployment will continue to climb, as well as the number of people fighting through the virus. All these things will impact valuation for at least the next 2 quarters, if not longer.
Despite the political games, I'm encouraged by the steps taken last week. To summarize, in the U.S., the government has created a giant cushion for the economy to land on. Some people have parachutes and are not concerned. Some will land in the middle, some will land on the edges, and some will miss it entirely. How quickly we get back on the mend depends on how quickly we can help those who weren't cushioned well.
So...as far as safe investing goes: income stocks are starting to look attractive by several measures, so update your watch list and watch those buy points. For growth stocks, it's been 6 weeks since the sell-off began, and that's the minimum for building a proper price pattern. Expect volatility to continue; I've seen some stocks fall past my theoretical stops (7-8%) in a day. Swing trading or momentum indicators are probably your best bet.
Someone asked me what the world will look like when this is all over. I told her that I didn't know what it will look like, but surely "cobra chickens" will have taken over.

Canada Goose - Courtesy of Wikipedia
Hats off and a big thank you to the brave men and women putting their health at risk in essential positions to keep the rest of us safe and healthy during this crisis.
Best to your week!
If you find this research helpful, please tell a friend. If you don't find it helpful, tell an enemy.
I regularly share articles and other news of interest via on Twitter (@investsafely), Facebook, Linkedin, and Instagram (@investsafely)
If you're interested in learning more about the relationship between price and volume, or how to find and trade the best stocks for your growth strategy, check out this book on Amazon via the following affiliate link: How to Make Money in Stocks: A Winning System in Good Times and Bad. It's one of my favorites.
Charts provided courtesy of stockcharts.com.
For the detailed Elliott Wave Analysis, go to the ELLIOTT WAVE lives on by Tony Caldaro.
Once a year, I review the market outlook signals as if they were a mechanical trading system, while pointing out issues and making adjustments. The goal is to give you to give you an example of how to analyze and continuously improve your own systems.
- 2015 Performance - Stock Market Outlook
- 2016 Performance - Stock Market Outlook
- 2017 Performance - Stock Market Outlook
- 2018 Performance - Stock Market Outlook
- 2019 Performance - Stock Market Outlook
IMPORTANT DISCLOSURE INFORMATION
This material is for general communication and is provided for informational and/or educational purposes only. None of the content should be viewed as a suggestion that you take or refrain from taking any action nor as a recommendation for any specific investment product, strategy, or other such purpose. Certain information contained herein has been obtained from third-party sources believed to be reliable, but we cannot guarantee its accuracy or completeness.
To the extent that a reader has any questions regarding the applicability of any specific issue discussed above to his/her individual situation, he/she is encouraged to consult with the professional advisors of his/her choosing. Invest Safely, LLC is not a law firm, certified public accounting firm, or registered investment advisor and no portion of its content should be construed as legal, accounting, or investment advice.
The material is not to be construed as an offer or a recommendation to buy or sell a security nor is it to be construed as investment advice. Additionally, the material accessible through this website does not constitute a representation that the investments described herein are suitable or appropriate for any person.
Hypothetical Presentations:
Any referenced performance is “as calculated” using the referenced funds and has not been independently verified. This presentation does not discuss, directly or indirectly, the amount of the profits or losses, realized or unrealized, by any reader or contributor, from any specific funds or securities.
The author and/or any reader may have experienced materially different performance based upon various factors during the corresponding time periods. To the extent that any portion of the content reflects hypothetical results that were achieved by means of the retroactive application of a back-tested model, such results have inherent limitations, including:
Model results do not reflect the results of actual trading using assets, but were achieved by means of the retroactive application of the referenced models, certain aspects of which may have been designed with the benefit of hindsight
Back-tested performance may not reflect the impact that any material market or economic factors might have had on the use of a trading model if the model had been used during the period to actually manage assets
Actual investment results during the corresponding time periods may have been materially different from those portrayed in the model
Past performance may not be indicative of future results. Therefore, no one should assume that future performance will be profitable, or equal to any corresponding historical index.
The S&P 500 Composite Total Return Index (the "S&P") is a market capitalization-weighted index of 500 widely held stocks often used as a proxy for the stock market. Standard & Poor's chooses the member companies for the S&P based on market size, liquidity, and industry group representation. Included are the common stocks of industrial, financial, utility, and transportation companies. The S&P is not an index into which an investor can directly invest. The historical S&P performance results (and those of all other indices) are provided exclusively for comparison purposes only, so as to provide general comparative information to assist an individual in determining whether the performance of a specific portfolio or model meets, or continues to meet investment objective(s). The model and indices performance results do not reflect the impact of taxes.
Investing involves risk (even the “safe” kind)! Past performance does not guarantee or indicate future results. Different types of investments involve varying degrees of underlying risk. Therefore, do not assume that future performance of any specific investment or investment strategy be suitable for your portfolio or individual situation, will be profitable, equal any historical performance level(s), or prove successful (including the investments and/or investment strategies describe on this site).
Popular Pages
- Jim Cramer- Personal Incomes Statements
- Hyperinflation
- Calculating Beta
- SMART Financial Goals
Blogroll
- Advisor Perspectives- Dividend Growth Investor
- Elliott Wave Lives On
- On My Radar | CMG Wealth
- Sure Dividend
- The Big Picture
- The Fat Pitch
- Thoughts from the Frontline
- Trader Feed
Sponsored Links
Invest Safely provides valuable, time-saving info about personal finance, money management, and investing.


