Stock Market Outlook
For The Week Of July 31st = Uptrend
INDICATORS
-
ADX Directional Indicators: Uptrend
Price & Volume Action: Uptrend
Elliott Wave Analysis: Mixed
The S&P500 ($SPX) found support at the 50-day moving average Tuesday, closing the week up 4.3%. The index is back near highs of early June, or lows of March, whichever you prefer. Either way, that zone creates a lot of overhead resistance (i.e. bag holders) for traders to work through.
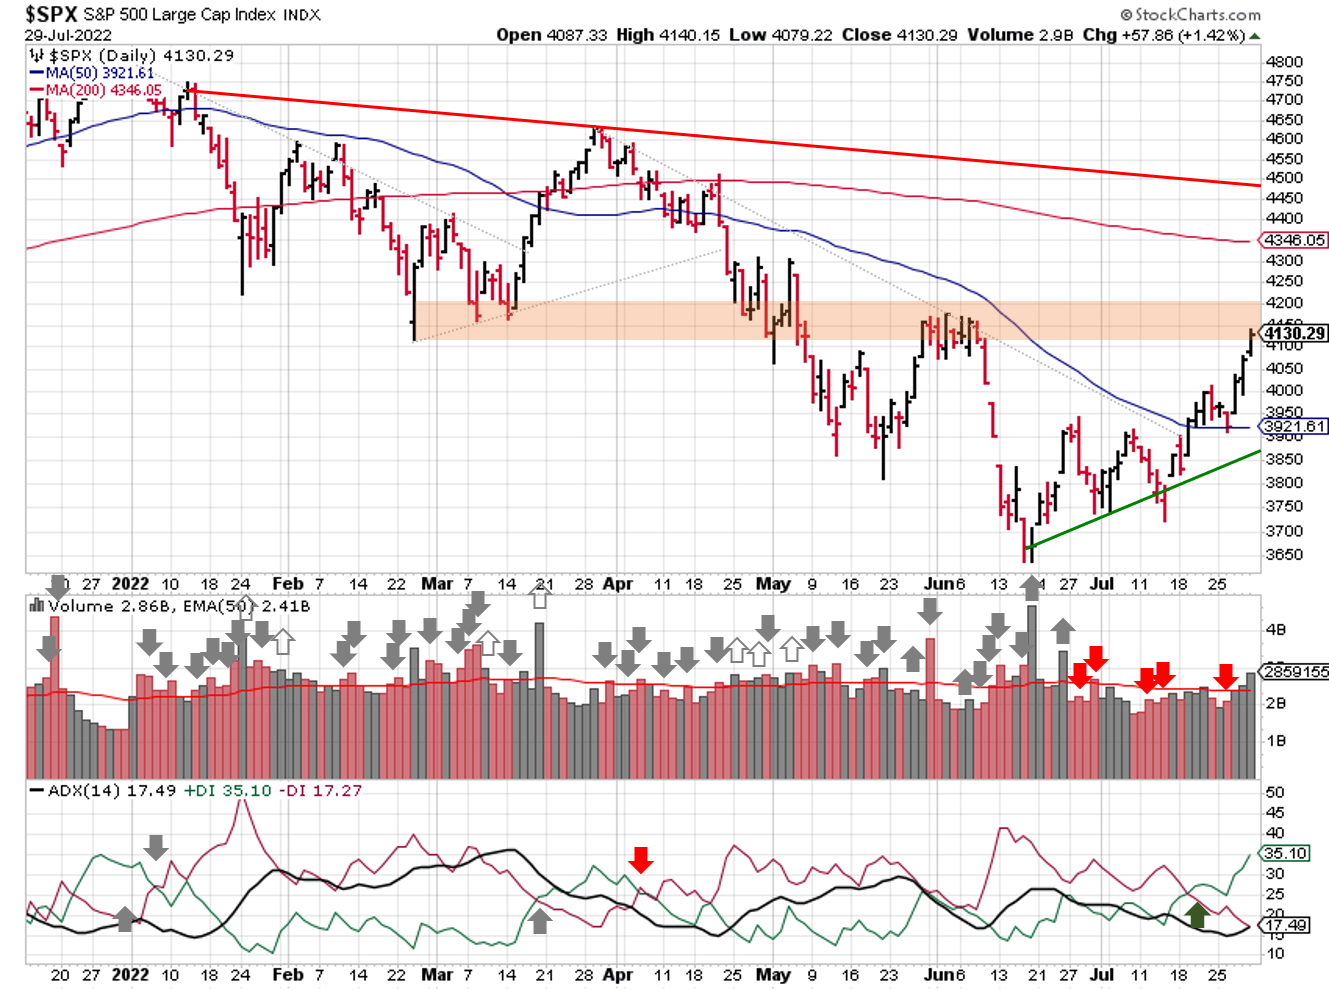
2022-07-31-SPX Trendline Analysis - Daily
No change in the underlying signals: ADX shows a bullish trend, as does the Price/Volume signal, while Elliott Wave is mixed. The bearish count, shown below, puts the market towards the end of the ongoing bear market bounce, with the index closing just above a target range for the C-wave of a 3-3-5 "flat" pattern (gold shading).
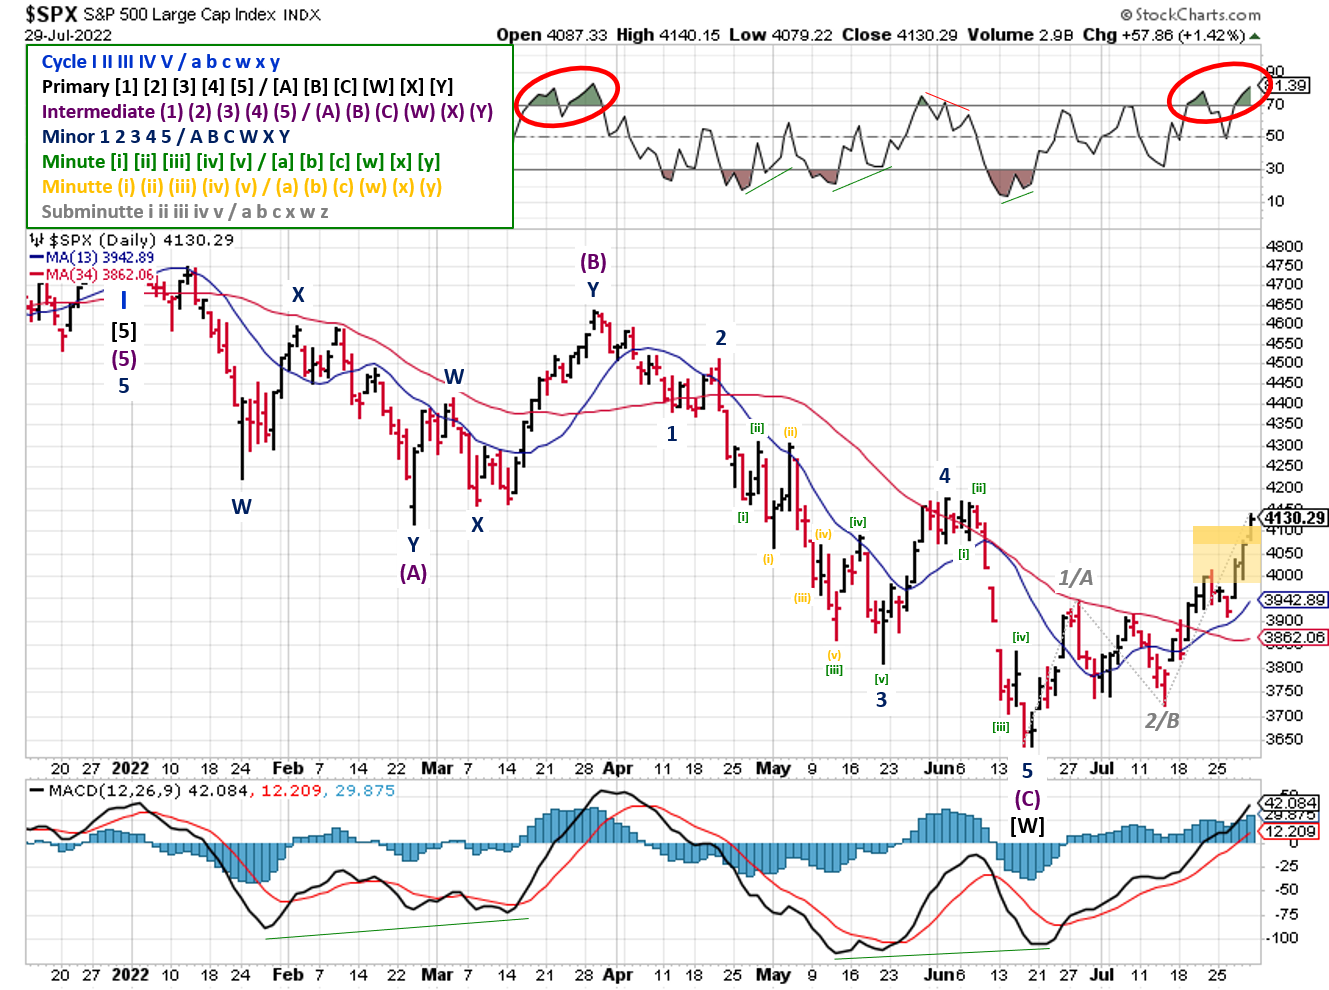
2022-07-31- SPX Elliott Wave Analysis - Daily - Primary Y
The RSI didn't confirm a top (via a divergence), but that's not necessarily required to end a corrective flat (see late March). A plausible (but not yet probable) bullish count, with the entire correction ending at the mid-June low, puts the SPX in the middle of the first wave of the next bull market.
COMMENTARY
"Better than expected" was last week's mantra when it came to financial markets.
For earnings, we touched on the issue of beating estimates verses year over year comparisons. As of Friday morning, 264 companies in the S&P500 had reported, with aggregate, year-over-year earnings falling -2%. Even positive headlines weren't all they were cracked up to be.
Take Apple ($AAPL) for instance. The company beat Wall Street expectations for sales and profit. But the year over year numbers weren't great. Revenue was up 2%, but earnings per share were down 8%. So even though their sales increased, their expenses increased more.
Amazon ($AMZN) also reported financial results, with a similar story to Apple. Headlines said the company reported better-than-expected Q2 revenue ($121B actual vs. $119B expected) and the outlook for Q3 was "upbeat". What about earnings; you know, actual profit? That figure came in at a loss of 20 cents per share. The company also cut ~100k people from it's workforce.
Some will point out that there are investment related losses in Amazon's EPS figure, which is true. There's ~$2B in losses from their investment in the electric truck manufacturer Rivian alone. So look at operating income, which excludes the investment-related losses. That metric hit $3.3 billion...down from $7.7 billion in Q2 of 2021...or 57% lower y-o-y.
The result? Amazon's stock price rallied 13%. You'd be hard pressed to find an answer to "tell me we're in a bear market bounce without telling me we're in a bear market bounce".
The U.S. Federal Reserve hiked short-term interest rates another 0.75%. Chairman Powell slipped in a reference to approaching the "natural interest rate" (whatever that means), and many people interpreted that as a sign the worst is over from a tightening perspective. Then I read an opinion that instead of 0.75% to 1% hikes, the Fed is only expected to hike 0.50, 0.25, and 0.25 over the next 3 meetings. We must have been watching different press conferences.
Inflation has likely peaked, as we discussed before. But even if it gets cut in half by the end of the year, which is unlikely, it would STILL be double the Fed target of 2%. And that doesn't even consider the ongoing impact of the Fed balance sheet reductions.
Q2 GDP couldn't keep up with expectations though, contracting -0.9% (a small increase increase was expected). The reading is the second consecutive quarter of negative growth (Q1 declined 1.6%).
Since the common definition of a recession is two consecutive quarters of negative GDP, you can see why there was so much airtime devoted to the topic last week. It seems that the 2 quarter definition is actually a rule of thumb, not anything "official". Pundits argue that the U.S. can't be in a recession because:
- The consumer is "strong"
- Corporate earnings aren't "as bad as expected"
- Unemployment is "low"
It's all relative of course, which means being "selective with data" like consumer spending and earnings comparisons as we've reviewed in prior posts. But unemployment really is low verses historical data, so I guess 1 out of 3 isn't bad. And we can always slice and dice employment data if the recession picks up speed and unemployment threatens to increase.
Financial media (social, online, and otherwise) is awash in calls that the bottom is in, and it's time to get off the sidelines. Unfortunately, that's not how market bottoms are made, from a sentiment perceptive.
Rest assured, the next bull market is coming, and will offer great buying opportunities. But those opportunities typically occur when retail investors throw in the towel and are disgusted with stocks, not buying them because data isn't as bad as expected.
In the meantime, look for companies that provide products and services you need to buy regardless of inflation (e.g. consumer staples ($XLP) and utilities ($XLU) ), with low beta values.
Best To Your Week!
P.S. If you find this research helpful, please tell a friend. If you don't, tell an enemy.
Sources: Bloomberg, CNBC, Hedgeye

How to Make Money in Stocks: A Winning System in Good Times and Bad.
It's one of my favorites.
I regularly share articles and other news of interest on:
Twitter (@investsafely)
Facebook (@InvestSafely)
LinkedIn (@Invest-Safely)
Instagram (@investsafely)
Invest Safely, LLC is an independent investment research and online financial media company. Use of Invest Safely, LLC and any other products available through invest-safely.com is subject to our Terms of Service and Privacy Policy. Not a recommendation to buy or sell any security.
Charts provided courtesy of stockcharts.com.
For historical Elliott Wave commentary and analysis, go to ELLIOTT WAVE lives on by Tony Caldaro. Current counts can be found at: Pretzel Logic, and 12345ABCDEWXYZ
Once a year, I review the market outlook signals as if they were a mechanical trading system, while pointing out issues and making adjustments. The goal is to give you to give you an example of how to analyze and continuously improve your own systems.
- 2015 Performance - Stock Market Outlook
- 2016 Performance - Stock Market Outlook
- 2017 Performance - Stock Market Outlook
- 2018 Performance - Stock Market Outlook
- 2019 Performance - Stock Market Outlook
- 2020 Performance - Stock Market Outlook
IMPORTANT DISCLOSURE INFORMATION
This material is for general communication and is provided for informational and/or educational purposes only. None of the content should be viewed as a suggestion that you take or refrain from taking any action nor as a recommendation for any specific investment product, strategy, or other such purpose. Certain information contained herein has been obtained from third-party sources believed to be reliable, but we cannot guarantee its accuracy or completeness.
To the extent that a reader has any questions regarding the applicability of any specific issue discussed above to his/her individual situation, he/she is encouraged to consult with the professional advisors of his/her choosing. Invest Safely, LLC is not a law firm, certified public accounting firm, or registered investment advisor and no portion of its content should be construed as legal, accounting, or investment advice.
The material is not to be construed as an offer or a recommendation to buy or sell a security nor is it to be construed as investment advice. Additionally, the material accessible through this website does not constitute a representation that the investments described herein are suitable or appropriate for any person.
Hypothetical Presentations:
Any referenced performance is “as calculated” using the referenced funds and has not been independently verified. This presentation does not discuss, directly or indirectly, the amount of the profits or losses, realized or unrealized, by any reader or contributor, from any specific funds or securities.
The author and/or any reader may have experienced materially different performance based upon various factors during the corresponding time periods. To the extent that any portion of the content reflects hypothetical results that were achieved by means of the retroactive application of a back-tested model, such results have inherent limitations, including:
Model results do not reflect the results of actual trading using assets, but were achieved by means of the retroactive application of the referenced models, certain aspects of which may have been designed with the benefit of hindsight
Back-tested performance may not reflect the impact that any material market or economic factors might have had on the use of a trading model if the model had been used during the period to actually manage assets
Actual investment results during the corresponding time periods may have been materially different from those portrayed in the model
Past performance may not be indicative of future results. Therefore, no one should assume that future performance will be profitable, or equal to any corresponding historical index.
The S&P 500 Composite Total Return Index (the "S&P") is a market capitalization-weighted index of 500 widely held stocks often used as a proxy for the stock market. Standard & Poor's chooses the member companies for the S&P based on market size, liquidity, and industry group representation. Included are the common stocks of industrial, financial, utility, and transportation companies. The S&P is not an index into which an investor can directly invest. The historical S&P performance results (and those of all other indices) are provided exclusively for comparison purposes only, so as to provide general comparative information to assist an individual in determining whether the performance of a specific portfolio or model meets, or continues to meet investment objective(s). The model and indices performance results do not reflect the impact of taxes.
Investing involves risk (even the “safe” kind)! Past performance does not guarantee or indicate future results. Different types of investments involve varying degrees of underlying risk. Therefore, do not assume that future performance of any specific investment or investment strategy be suitable for your portfolio or individual situation, will be profitable, equal any historical performance level(s), or prove successful (including the investments and/or investment strategies describe on this site).
Investing Process Links
Stabilize- Organize your $$$
- Manage your $$$
Plan
- Why You Invest
- Ways to Invest
- Where to Invest
- What to Invest In
Execute
- When to Invest
- How Much to Invest
- Buying & Selling
Monitor
- Track The Market
- Track Your Returns
Reflect & Adjust
- Improve Your Returns
- Adjust your Holdings
Popular Pages
- Jim Cramer- Personal Incomes Statements
- Hyperinflation
- Calculating Beta
- SMART Financial Goals
Blogroll
- Advisor Perspectives- Dividend Growth Investor
- Elliott Wave Lives On
- On My Radar | CMG Wealth
- Sure Dividend
- The Big Picture
- The Fat Pitch
- Thoughts from the Frontline
- Trader Feed
Sponsored Links
Invest Safely provides valuable, time-saving info about personal finance, money management, and investing.


