Stock Market Outlook
For The Week Of February 7th = Uptrend
INDICATORS
-
ADX Directional Indicators: Uptrend
Price & Volume Action: Uptrend
Elliott Wave Analysis: Uptrend
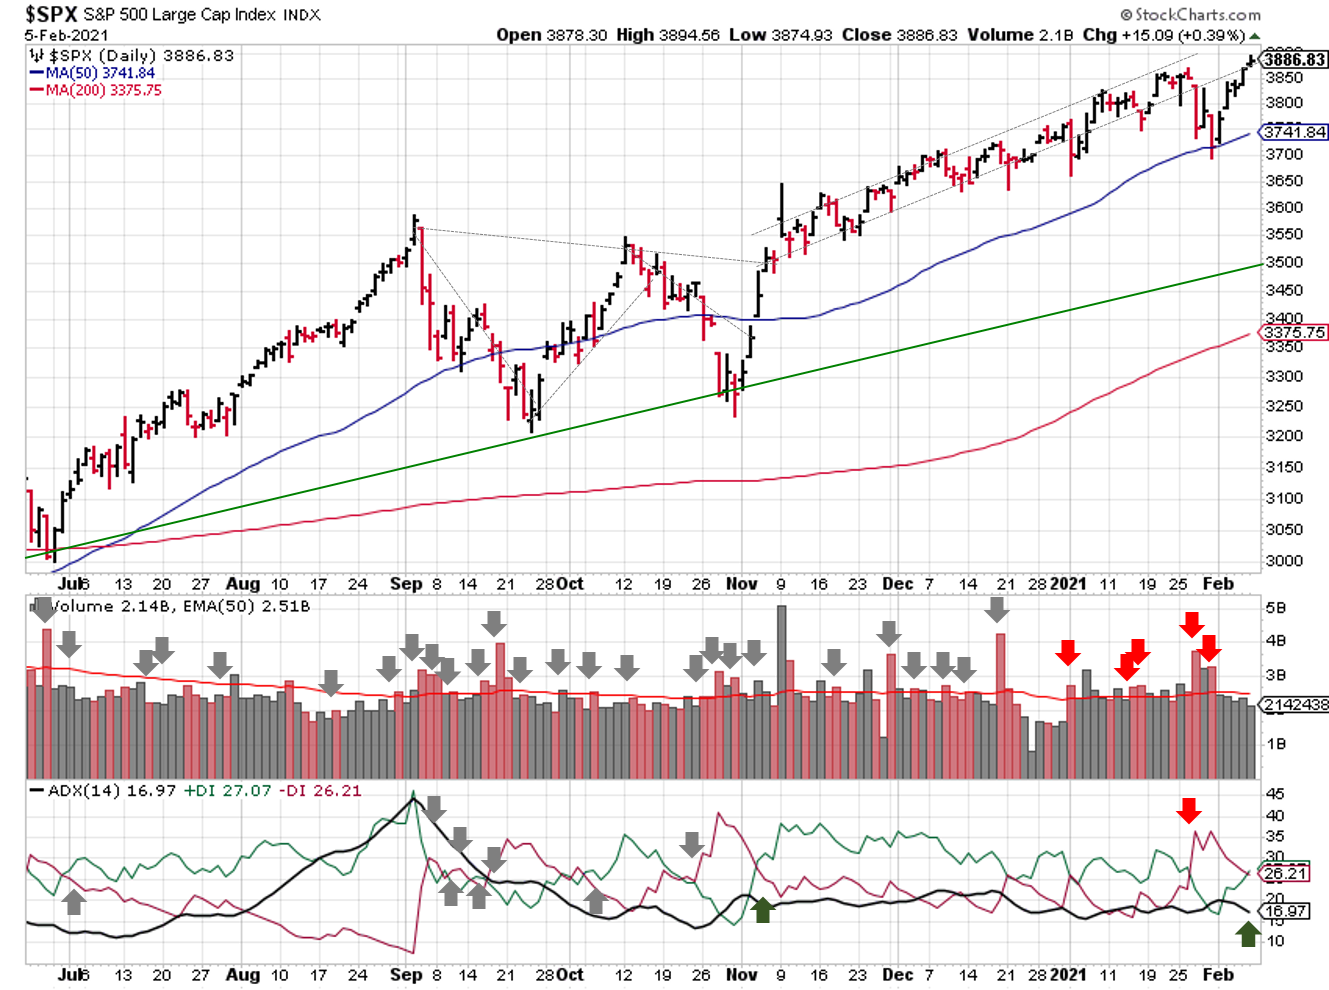
2021-02-07-SPX Trendline Analysis - Daily
The S&P500 ($SPX) bounced off its 50-day moving average and ended the week at an all time high. The ADX still shows a weak trend in place, but the directional indicators flipped to bullish on Friday (just barely). The price/volume signal shifted back to an uptrend thanks to Monday’s bounce and no new distribution days.
A look under the hood, and there is still cause for concern:
- The index sits ~15% above the 200-day
- Trading volume was below average all week
- Trading volume declined as prices rose
Even though there's an uptrend in place, keep watch. Prices take the stairs up and the elevator down.

2021-02-07-SPX Elliott Wave Analysis - Daily - Primary 1
For Elliott Wave, the positive RSI divergence mentioned last week did indeed signal the end of the correction, which on a bit on the small side (only reaching the ~24% retracement level rather than the 38%). The long-term view continues to show substantial negative divergences in RSI and the MACD.
COMMENTARY
We got January's unemployment report, which showed a decrease from 6.7% to 6.3%. All is well, right?

Again, take a look under the hood. The U.S. saw an increase of 49k was about half of what was expected. And job losses in December were revised upward by 62%! The unemployment rate fell because labor-force participation declined.
But all is not lost. More than likely, this information bolsters the case for more fiscal stimulus, which will have a positive effect on the stock market. Infection rates are improving, as is vaccine distribution, so economic activity is likely to improve as well.
Coincidentally, some investors I greatly respect say that the market top is in and we're going to see a major correction. We'll only know if they're right in hindsight, and even they acknowledge that they're probably early. But the fact that they've coming out publicly and saying that it's time to cash out is worth noting.
The stock market has had a good run since November, so don't be shy about taking some money off the table (e.g. recover your initial investment). Keep your losses small no matter what. You can always buy back in if/when price action improves.
Best to Your Week!
P.S. Head on over to Epsilon Theory, read their take on the "Reddit Revolt", and let me know what you think.
https://www.epsilontheory.com/hunger-games/
If you find this research helpful, please tell a friend. If you don't find it helpful, tell an enemy.
I regularly share articles and other news of interest via on Twitter (@investsafely), Facebook, Linkedin, and Instagram (@investsafely)
If you're interested in learning more about the relationship between price and volume, or how to find and trade the best stocks for your growth strategy, check out this book on Amazon via the following affiliate link:

How to Make Money in Stocks: A Winning System in Good Times and Bad.
It's one of my favorites.
Charts provided courtesy of stockcharts.com.
For the detailed Elliott Wave Analysis, go to the ELLIOTT WAVE lives on by Tony Caldaro.
Once a year, I review the market outlook signals as if they were a mechanical trading system, while pointing out issues and making adjustments. The goal is to give you to give you an example of how to analyze and continuously improve your own systems.
- 2015 Performance - Stock Market Outlook
- 2016 Performance - Stock Market Outlook
- 2017 Performance - Stock Market Outlook
- 2018 Performance - Stock Market Outlook
- 2019 Performance - Stock Market Outlook
IMPORTANT DISCLOSURE INFORMATION
This material is for general communication and is provided for informational and/or educational purposes only. None of the content should be viewed as a suggestion that you take or refrain from taking any action nor as a recommendation for any specific investment product, strategy, or other such purpose. Certain information contained herein has been obtained from third-party sources believed to be reliable, but we cannot guarantee its accuracy or completeness.
To the extent that a reader has any questions regarding the applicability of any specific issue discussed above to his/her individual situation, he/she is encouraged to consult with the professional advisors of his/her choosing. Invest Safely, LLC is not a law firm, certified public accounting firm, or registered investment advisor and no portion of its content should be construed as legal, accounting, or investment advice.
The material is not to be construed as an offer or a recommendation to buy or sell a security nor is it to be construed as investment advice. Additionally, the material accessible through this website does not constitute a representation that the investments described herein are suitable or appropriate for any person.
Hypothetical Presentations:
Any referenced performance is “as calculated” using the referenced funds and has not been independently verified. This presentation does not discuss, directly or indirectly, the amount of the profits or losses, realized or unrealized, by any reader or contributor, from any specific funds or securities.
The author and/or any reader may have experienced materially different performance based upon various factors during the corresponding time periods. To the extent that any portion of the content reflects hypothetical results that were achieved by means of the retroactive application of a back-tested model, such results have inherent limitations, including:
Model results do not reflect the results of actual trading using assets, but were achieved by means of the retroactive application of the referenced models, certain aspects of which may have been designed with the benefit of hindsight
Back-tested performance may not reflect the impact that any material market or economic factors might have had on the use of a trading model if the model had been used during the period to actually manage assets
Actual investment results during the corresponding time periods may have been materially different from those portrayed in the model
Past performance may not be indicative of future results. Therefore, no one should assume that future performance will be profitable, or equal to any corresponding historical index.
The S&P 500 Composite Total Return Index (the "S&P") is a market capitalization-weighted index of 500 widely held stocks often used as a proxy for the stock market. Standard & Poor's chooses the member companies for the S&P based on market size, liquidity, and industry group representation. Included are the common stocks of industrial, financial, utility, and transportation companies. The S&P is not an index into which an investor can directly invest. The historical S&P performance results (and those of all other indices) are provided exclusively for comparison purposes only, so as to provide general comparative information to assist an individual in determining whether the performance of a specific portfolio or model meets, or continues to meet investment objective(s). The model and indices performance results do not reflect the impact of taxes.
Investing involves risk (even the “safe” kind)! Past performance does not guarantee or indicate future results. Different types of investments involve varying degrees of underlying risk. Therefore, do not assume that future performance of any specific investment or investment strategy be suitable for your portfolio or individual situation, will be profitable, equal any historical performance level(s), or prove successful (including the investments and/or investment strategies describe on this site).
Popular Pages
- Jim Cramer- Personal Incomes Statements
- Hyperinflation
- Calculating Beta
- SMART Financial Goals
Blogroll
- Advisor Perspectives- Dividend Growth Investor
- Elliott Wave Lives On
- On My Radar | CMG Wealth
- Sure Dividend
- The Big Picture
- The Fat Pitch
- Thoughts from the Frontline
- Trader Feed
Sponsored Links
Invest Safely provides valuable, time-saving info about personal finance, money management, and investing.


