Weekend Stock Market Outlook
Stock Market Outlook For The Week of
May 10th = Uptrend
INDICATORS
ADX Directional Indicators: Uptrend
Price & Volume Action: Uptrend
Elliott Wave Analysis: Downtrend
The stock market outlook continues into the second week of May in an uptrend. The ADX and price/volume signals show an uptrend, while Elliott Wave indicates a downtrend.
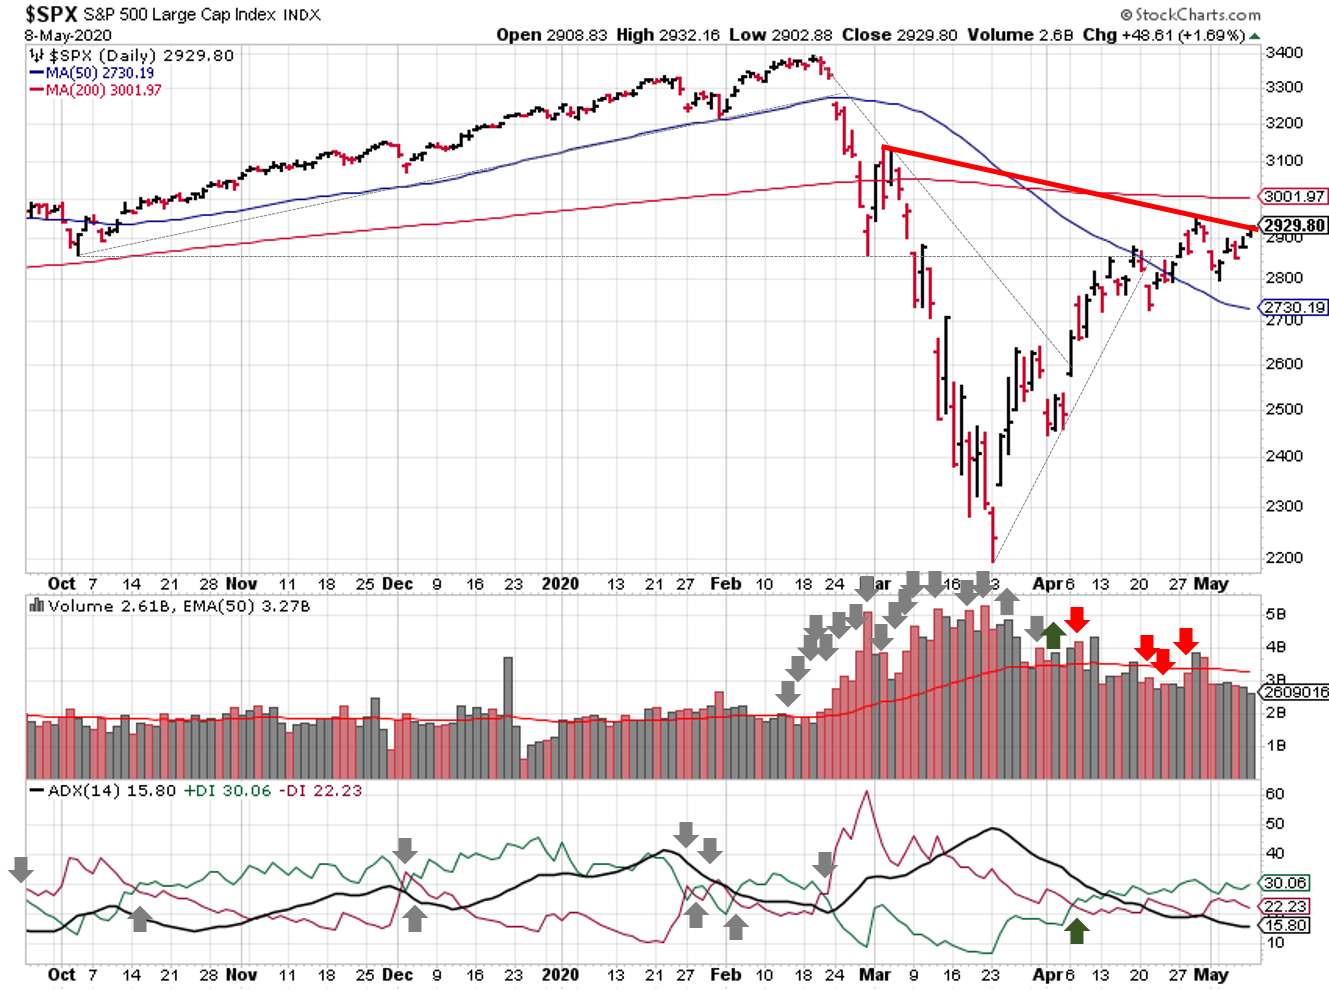
2020-05-10-SPX Trendline Analysis - Daily
The S&P500 ($SPX) spent last week recovering from the prior week's sell-off. No real change in the ADX or price/volume story. The downward trendline also remains in place, just barely, with the SPX starting the week right on the line.
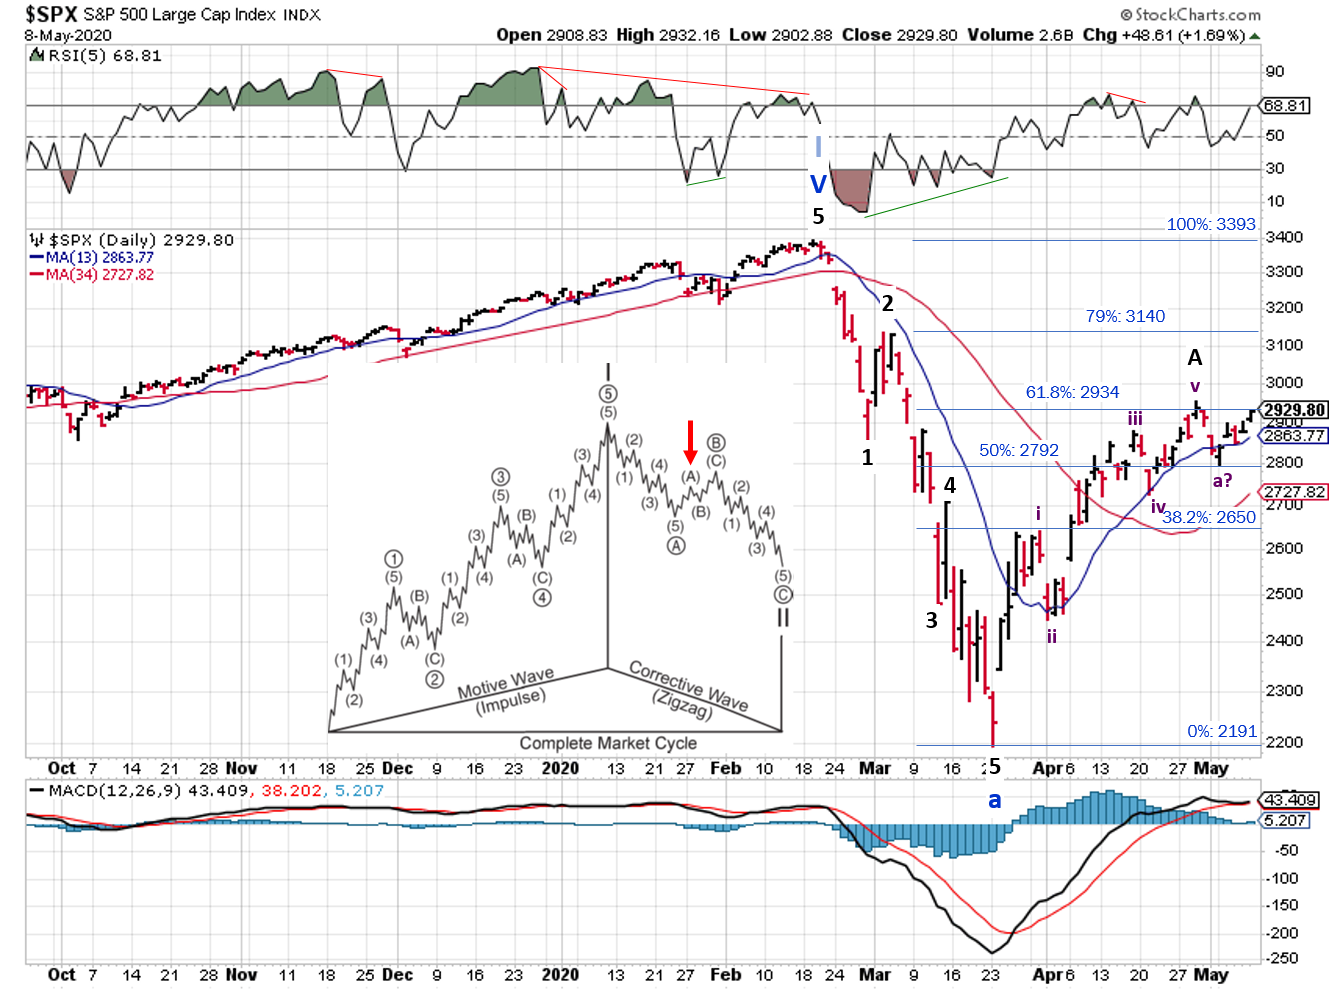
2020-05-10-SPX Elliott Wave Analysis - Daily
For Elliott wave, the S&P500 is challenging the 61.8% level retracement level again.
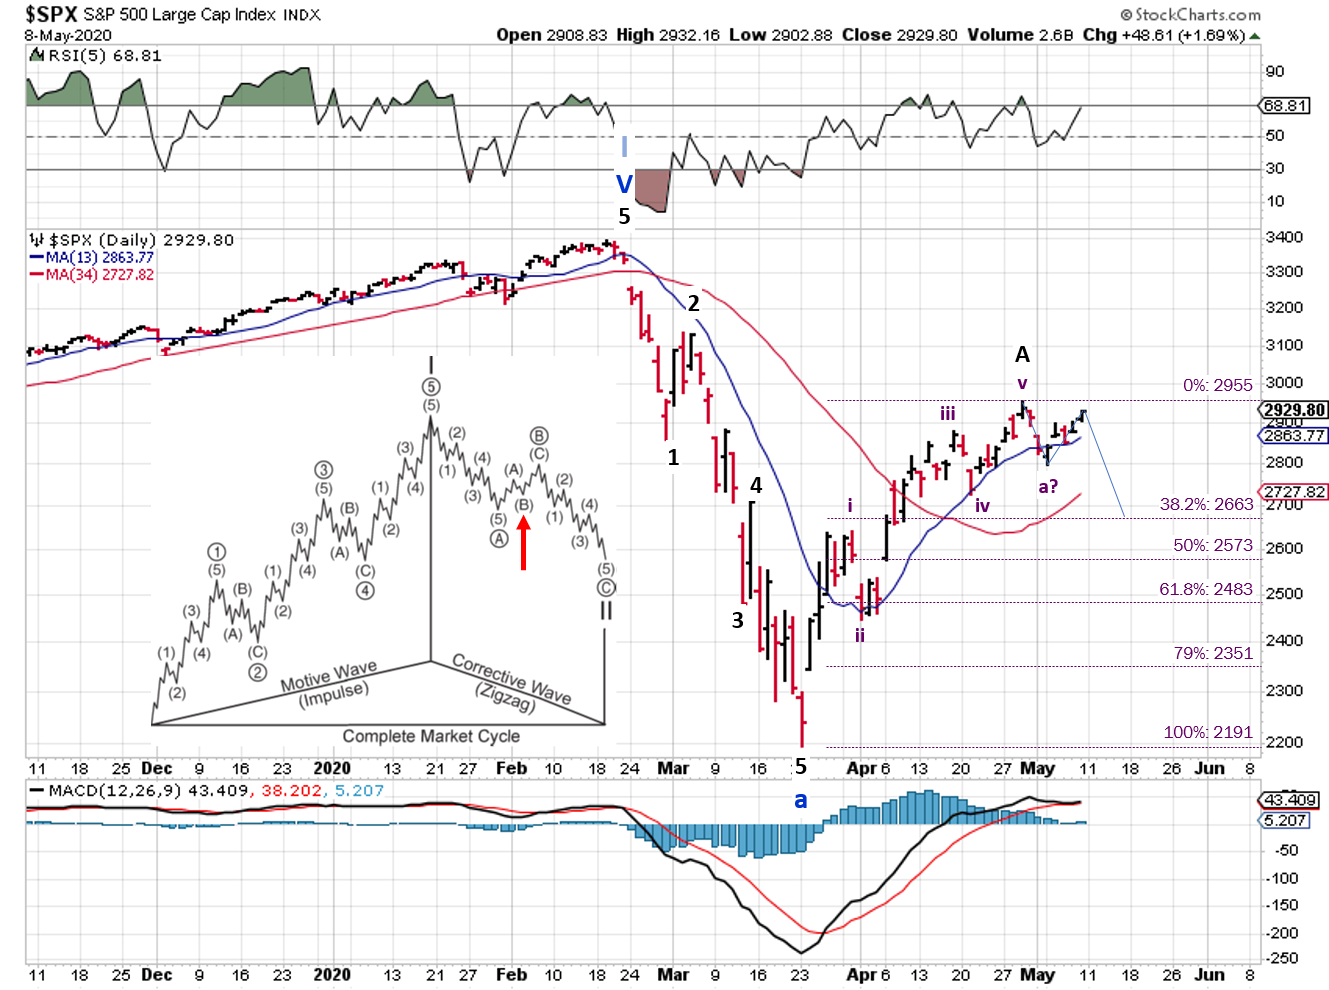
2020-05-10-SPX Elliott Wave Analysis - Daily - b-wave
Last week, we discussed the possibility of a flat or triangle creating a shallow price decline rather than a zigzag. If Monday's low was really the end of a subwave, then odds decrease for the plotted zigzag price targets. I'll leave them in for this week, and lets see what market prices have in store for us.
And here's the weekly view, going back to the last recession, for some context.

2020-05-10-SPX Trendline Analysis - Weekly
The April jobs report came and went, showing 20.5 million jobs were lost. Investors reacted with a shrug, seeming to focus more on the fact that 80% of the job losses were reported as temporary layoffs. The disconnect between Main Street and Wall Street seems to grow each day, with job/income losses in stark contrast with rising stock prices and shareholder value. Not to mention the fact that we're at the end of a long-term debt cycle.
That's not a recipe for success...that's a recipe for revolt! Hopefully, cooler heads and leaders prevail.
What remains to be seen is whether the job losses lead to prolong reductions in consumer spending. Shutting down businesses means we CAN'T spend, but opening them back up doesn't mean that we WILL spend. In the U.S., consumer spending makes up 70% of the economy, and will determine the strength of the recovery. The stock market seems to be predicting a strong recovery, with the S&P sitting ~15% off its all time high already!
As always, let price be your guide and respond accordingly.
Best to your week!
If you find this research helpful, please tell a friend. If you don't find it helpful, tell an enemy.
I regularly share articles and other news of interest via on Twitter (@investsafely), Facebook, Linkedin, and Instagram (@investsafely)
If you're interested in learning more about the relationship between price and volume, or how to find and trade the best stocks for your growth strategy, check out this book on Amazon via the following affiliate link:

How to Make Money in Stocks: A Winning System in Good Times and Bad.
It's one of my favorites.
Charts provided courtesy of stockcharts.com.
For the detailed Elliott Wave Analysis, go to the ELLIOTT WAVE lives on by Tony Caldaro.
Once a year, I review the market outlook signals as if they were a mechanical trading system, while pointing out issues and making adjustments. The goal is to give you to give you an example of how to analyze and continuously improve your own systems.
- 2015 Performance - Stock Market Outlook
- 2016 Performance - Stock Market Outlook
- 2017 Performance - Stock Market Outlook
- 2018 Performance - Stock Market Outlook
- 2019 Performance - Stock Market Outlook
IMPORTANT DISCLOSURE INFORMATION
This material is for general communication and is provided for informational and/or educational purposes only. None of the content should be viewed as a suggestion that you take or refrain from taking any action nor as a recommendation for any specific investment product, strategy, or other such purpose. Certain information contained herein has been obtained from third-party sources believed to be reliable, but we cannot guarantee its accuracy or completeness.
To the extent that a reader has any questions regarding the applicability of any specific issue discussed above to his/her individual situation, he/she is encouraged to consult with the professional advisors of his/her choosing. Invest Safely, LLC is not a law firm, certified public accounting firm, or registered investment advisor and no portion of its content should be construed as legal, accounting, or investment advice.
The material is not to be construed as an offer or a recommendation to buy or sell a security nor is it to be construed as investment advice. Additionally, the material accessible through this website does not constitute a representation that the investments described herein are suitable or appropriate for any person.
Hypothetical Presentations:
Any referenced performance is “as calculated” using the referenced funds and has not been independently verified. This presentation does not discuss, directly or indirectly, the amount of the profits or losses, realized or unrealized, by any reader or contributor, from any specific funds or securities.
The author and/or any reader may have experienced materially different performance based upon various factors during the corresponding time periods. To the extent that any portion of the content reflects hypothetical results that were achieved by means of the retroactive application of a back-tested model, such results have inherent limitations, including:
Model results do not reflect the results of actual trading using assets, but were achieved by means of the retroactive application of the referenced models, certain aspects of which may have been designed with the benefit of hindsight
Back-tested performance may not reflect the impact that any material market or economic factors might have had on the use of a trading model if the model had been used during the period to actually manage assets
Actual investment results during the corresponding time periods may have been materially different from those portrayed in the model
Past performance may not be indicative of future results. Therefore, no one should assume that future performance will be profitable, or equal to any corresponding historical index.
The S&P 500 Composite Total Return Index (the "S&P") is a market capitalization-weighted index of 500 widely held stocks often used as a proxy for the stock market. Standard & Poor's chooses the member companies for the S&P based on market size, liquidity, and industry group representation. Included are the common stocks of industrial, financial, utility, and transportation companies. The S&P is not an index into which an investor can directly invest. The historical S&P performance results (and those of all other indices) are provided exclusively for comparison purposes only, so as to provide general comparative information to assist an individual in determining whether the performance of a specific portfolio or model meets, or continues to meet investment objective(s). The model and indices performance results do not reflect the impact of taxes.
Investing involves risk (even the “safe” kind)! Past performance does not guarantee or indicate future results. Different types of investments involve varying degrees of underlying risk. Therefore, do not assume that future performance of any specific investment or investment strategy be suitable for your portfolio or individual situation, will be profitable, equal any historical performance level(s), or prove successful (including the investments and/or investment strategies describe on this site).
Popular Pages
- Jim Cramer- Personal Incomes Statements
- Hyperinflation
- Calculating Beta
- SMART Financial Goals
Blogroll
- Advisor Perspectives- Dividend Growth Investor
- Elliott Wave Lives On
- On My Radar | CMG Wealth
- Sure Dividend
- The Big Picture
- The Fat Pitch
- Thoughts from the Frontline
- Trader Feed
Sponsored Links
Invest Safely provides valuable, time-saving info about personal finance, money management, and investing.


