Weekend Stock Market Outlook
Stock Market Outlook For The Week of
March 15th = Downtrend
INDICATORS
ADX Directional Indicators: Downtrend
Price & Volume Action: Downtrend
Objective Elliott Wave Analysis: Downtrend
The stock market outlook remains in a downtrend; no change in the ADX, price/volume, or Elliott Wave. Uncertainty still rules the day, and will continue to do so for the next few weeks at a minimum.
Support and resistance levels are coming fast and furious these days. I figured we had a few days before the S&P would test the 2750 support target identified in last week's update. Instead, the S&P tested that level on Monday after falling more than 7%! Unless your a trader, it's going to be hard to capture these moves.
The volatility reminds me of the late 2000s, but it's definitely not the same. 9% price moves are just crazy, not to mention a week of 5% or greater moves...in an index of 500 companies!
Sudden price moves like we've witnessed over the past two weeks tend to catch traders off guard, and there's been speculation that certain funds have "blown up". That's a technical term meaning they've had to sell all their holdings at whatever price they can get to cover margin calls, etc. Anecdotal evidence comes from the recent poor performance of assets like gold or silver (even bitcoin!). All are considered "save havens" in times of crisis, but they've sold off with stocks.
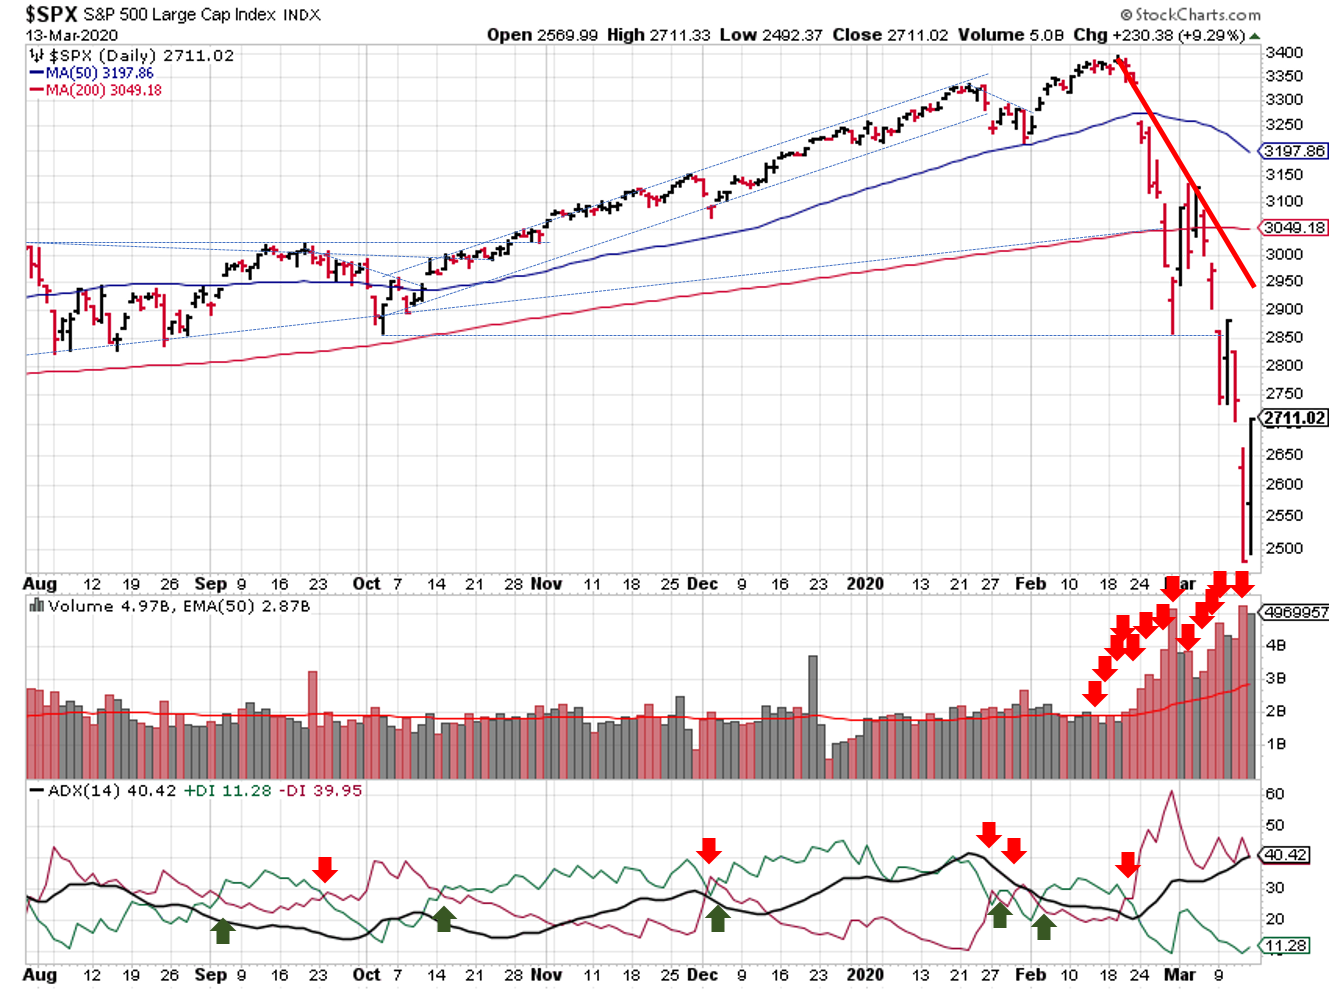
2020-03-15 - SPX Trendline Analysis - Daily
The S&P500 ($SPX) chart shows what you'd expect; massive price movement and high trading volumes. It's going to take some time to work those distribution days off the count. Individual stocks will likely signal an potential uptrend before any of the indexes turn around.
I've been reviewing the current OEW wave count, and although I'm no expert, the graphs just don't seem to be aligned with the current market environment. The counts are definitely "possible", because they don't violate any rules. But the future implications of their current analysis doesn't seem plausible, given the speed and depth of the current sell-off and the likely impact of a demand shock on the economy.
Tony always said trade what's in front of you. So I'm providing a first go what's in front of me, as an alternate count for those who are interested. I'm sure my labeling is off; I'm still playing with the intermediate waves within the Major 5 in 2019. Work in progress, but if correct, it corresponds with a bear market for stocks.

2020-03-15 - SPX Trendline Analysis - Weekly
As if we needed more black swans flying around, OPEC and Russia decided to enter a price war over oil. For those of you that are counting, that's:
- A supply shock in global supply chains, resulting from the shutdown of Chinese factories in response to the COVID-19 outbreak
- A demand shock from a drop in Chinese consumption, resulting from the lockdown of a majority of the Chinese population during their New Year's Festival, in an attempt to contain the COVID-19 epidemic
- A developing supply shock to oil markets, resulting from a price war between OPEC and Russia
- A developing demand shock from a drop in global consumption, resulting from travel bans, quarantines, lockdowns, and "social distancing" measures enacted across the globe in response to the COVID-19 pandemic
As we've discussed, fundamentals aren't going to help you in times like this, because the shocks have to work their way through supply and value chains. We'll know more when firms start to report first quarter earnings in April. By July, the uncertainty around the demand and supply shocks should subside, and we'll know how much earnings have been impacted and whether a recession has taken hold. Until then, markets will continue to react to every headline, so expect high volatility to continue.
In the meantime, federal and state governments are working on fiscal support for sick/laid-off workers and impacted sectors of the economy to try and soften the blow, but there's still a high probability that these shocks result in defaults and/or bankruptcies in several sectors of the economy (energy, retail, entertainment).
This week we'll see policy meetings for at least 10 central banks, including the U.S. Fed. And moments ago, the Fed announced an emergency stimulus package, cutting interest rates to 0% and starting a $700B asset purchase program.
Best to your week!
If you find this research helpful, please tell a friend. If you don't find it helpful, tell an enemy. I share articles and other news of interest via Twitter; you can follow me @investsafely. The weekly market outlook is also posted on Facebook and Linkedin.
Charts provided courtesy of stockcharts.com.
If you're interested in learning more about the relationship between price and volume, or how to find and trade the best stocks for your growth strategy, check out this book on Amazon via the following affiliate link: How to Make Money in Stocks: A Winning System in Good Times and Bad. It's one of my favorites.
For the detailed Elliott Wave Analysis, go to the ELLIOTT WAVE lives on by Tony Caldaro.
Once a year, I review the market outlook signals as if they were a mechanical trading system, while pointing out issues and making adjustments. The goal is to give you to give you an example of how to analyze and continuously improve your own systems.
- 2015 Performance - Stock Market Outlook
- 2016 Performance - Stock Market Outlook
- 2017 Performance - Stock Market Outlook
- 2018 Performance - Stock Market Outlook
- 2019 Performance - Stock Market Outlook
IMPORTANT DISCLOSURE INFORMATION
This material is for general communication and is provided for informational and/or educational purposes only. None of the content should be viewed as a suggestion that you take or refrain from taking any action nor as a recommendation for any specific investment product, strategy, or other such purpose. Certain information contained herein has been obtained from third-party sources believed to be reliable, but we cannot guarantee its accuracy or completeness.
To the extent that a reader has any questions regarding the applicability of any specific issue discussed above to his/her individual situation, he/she is encouraged to consult with the professional advisors of his/her choosing. Invest Safely, LLC is not a law firm, certified public accounting firm, or registered investment advisor and no portion of its content should be construed as legal, accounting, or investment advice.
The material is not to be construed as an offer or a recommendation to buy or sell a security nor is it to be construed as investment advice. Additionally, the material accessible through this website does not constitute a representation that the investments described herein are suitable or appropriate for any person.
Hypothetical Presentations:
Any referenced performance is “as calculated” using the referenced funds and has not been independently verified. This presentation does not discuss, directly or indirectly, the amount of the profits or losses, realized or unrealized, by any reader or contributor, from any specific funds or securities.
The author and/or any reader may have experienced materially different performance based upon various factors during the corresponding time periods. To the extent that any portion of the content reflects hypothetical results that were achieved by means of the retroactive application of a back-tested model, such results have inherent limitations, including:
Model results do not reflect the results of actual trading using assets, but were achieved by means of the retroactive application of the referenced models, certain aspects of which may have been designed with the benefit of hindsight
Back-tested performance may not reflect the impact that any material market or economic factors might have had on the use of a trading model if the model had been used during the period to actually manage assets
Actual investment results during the corresponding time periods may have been materially different from those portrayed in the model
Past performance may not be indicative of future results. Therefore, no one should assume that future performance will be profitable, or equal to any corresponding historical index.
The S&P 500 Composite Total Return Index (the "S&P") is a market capitalization-weighted index of 500 widely held stocks often used as a proxy for the stock market. Standard & Poor's chooses the member companies for the S&P based on market size, liquidity, and industry group representation. Included are the common stocks of industrial, financial, utility, and transportation companies. The S&P is not an index into which an investor can directly invest. The historical S&P performance results (and those of all other indices) are provided exclusively for comparison purposes only, so as to provide general comparative information to assist an individual in determining whether the performance of a specific portfolio or model meets, or continues to meet investment objective(s). The model and indices performance results do not reflect the impact of taxes.
Investing involves risk (even the “safe” kind)! Past performance does not guarantee or indicate future results. Different types of investments involve varying degrees of underlying risk. Therefore, do not assume that future performance of any specific investment or investment strategy be suitable for your portfolio or individual situation, will be profitable, equal any historical performance level(s), or prove successful (including the investments and/or investment strategies describe on this site).
Popular Pages
- Jim Cramer- Personal Incomes Statements
- Hyperinflation
- Calculating Beta
- SMART Financial Goals
Blogroll
- Advisor Perspectives- Dividend Growth Investor
- Elliott Wave Lives On
- On My Radar | CMG Wealth
- Sure Dividend
- The Big Picture
- The Fat Pitch
- Thoughts from the Frontline
- Trader Feed
Sponsored Links
Invest Safely provides valuable, time-saving info about personal finance, money management, and investing.


