Weekend Stock Market Outlook
Stock Market Outlook For The Week of
February 3rd = Uptrend
INDICATORS
20/50 Day Moving Averages: Uptrend
Price & Volume Action: Uptrend
Objective Elliott Wave Analysis: Uptrend
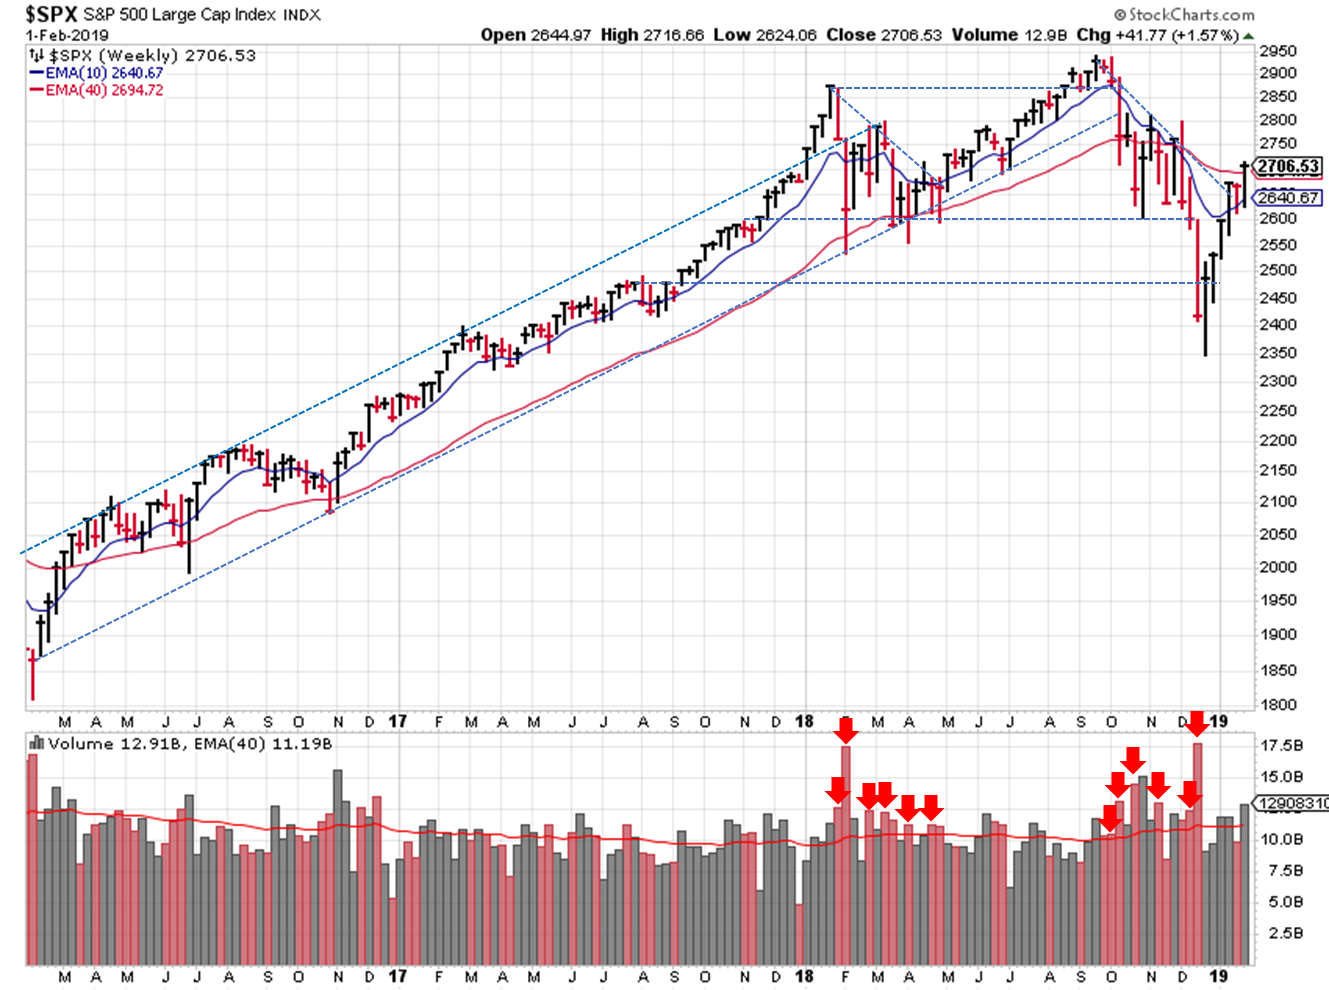
In the weekly view, we see another close at the highs...that's 5 straight weeks. Three of them on higher than average trading volume. The 2018 Q4 downtrend we've been following is finished and prices ended the week above the 40-week moving average. We still don't have a "low" to use for the new uptrend. But we can say that when we do see that low, it represents a good buying opportunity in the near future, rather than a continuation of the downtrend.
2019-02-03 - SPX Trendline Analysis - Weekly
Switching to a daily view, the S&P ($SPX) found support at the 50-day moving average, broke the 2018 Q4 downtrend, and closed above the 200-day moving average (with volume). Mirroring the weekly view, the SPX still needs to put in a higher "low" price of some kind. For now, we'll use what we have to estimate the trendline.
2019-02-03 - SPX Trendline Analysis - Daily
The DI+ / DI- continues to show a bullish environment. Price and volume was bullish last week, courtesy of high volume accumulation days. The latest OEW analysis also puts us back in an uptrend, with the probability of a new bull market 80%.
2019-02-03 - US Stock Market Averages
More broadly speaking, all the indexes start the week above their 50 day moving averages. The VIX is back around 16...is that an indication we'll see a spike in volatility? Asking for a friend...
So what investing "lessons learned" can we take away from January? Don't fight the Fed. It's amazing what a few dovish speeches will do in today's trading environment, considering nothing has changed in the past few weeks (underlying fundamentals, etc.).
If you find this research helpful, please tell a friend. If you don't find it helpful, tell an enemy. I share articles and other news of interest via Twitter; you can follow me @investsafely. The weekly market outlook is also posted on Facebook and Linkedin.
Once a year, I review the market outlook signals as if they were a mechanical trading system, while pointing out issues and making adjustments. The goal is to provide an example of how to analyze and continuously improve a trading system.
- 2015 Performance - Stock Market Outlook
- 2016 Performance - Stock Market Outlook
- 2017 Performance - Stock Market Outlook
For the detailed Elliott Wave Analysis, go to the ELLIOTT WAVE lives on by Tony Caldaro. Charts provided courtesy of stockcharts.com.


