Weekend Stock Market Outlook
Stock Market Outlook For The Week of
September 16th = Uptrend
INDICATORS
20/50 Day Moving Averages: Uptrend
Price & Volume Action: Uptrend
Objective Elliott Wave Analysis: Uptrend
Looks like the stock market opted for a run at new highs, rather than searching for support. A quick run through a bunch of recession indicators (trends in the yield curve, unemployment, new home sales, retail sales, etc.) shows no sign of a recession with the next 12 months. So even if the markets do test support key support levels sometime soon, it's most likely a buy the dip opportunity.
All the indexes start the week above their 20 and 50 day moving averages; the Nasdaq and NYSE regained the 20 day average last week.

2018-09-16 - US Stock Market Averages
A solid week of gains on rising trading volume last week; not quite as much volume as expected, but we're in a positive position nonetheless.
OEW is still in an uptrend, and still expecting new highs in all market averages before any kind of next major correction.
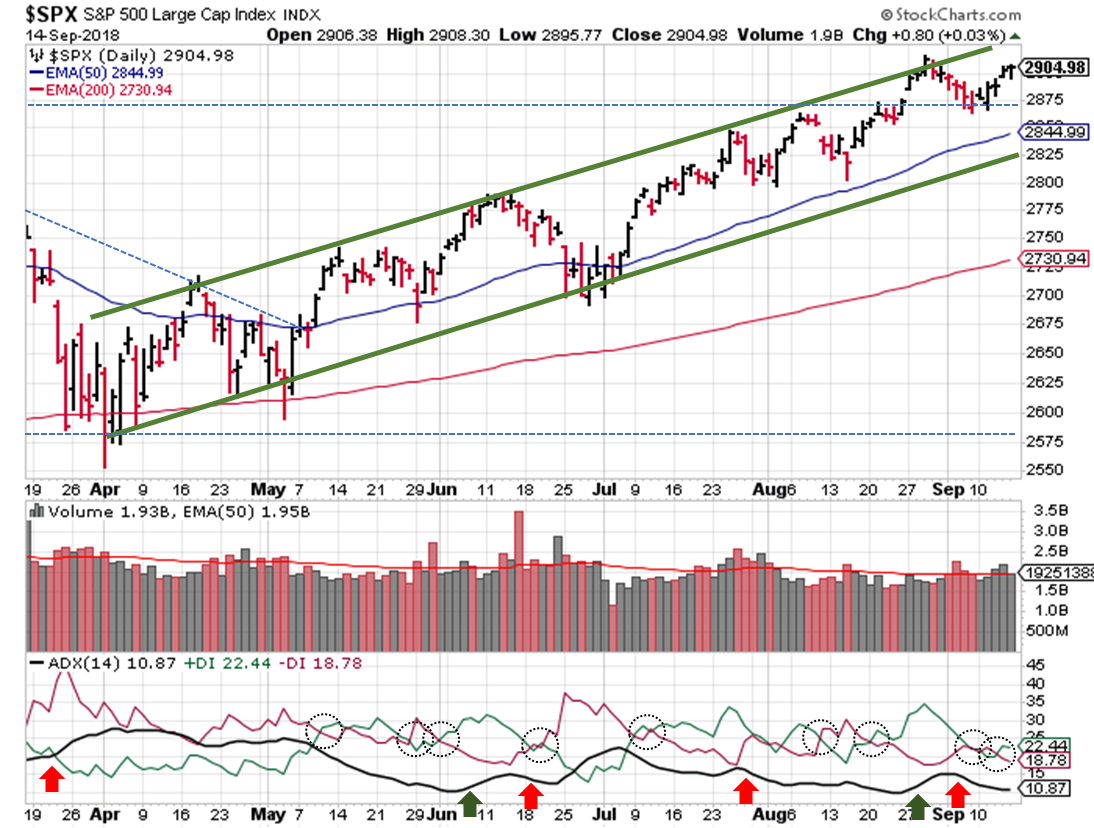
2018-09-16 - SPX Technical Analysis - Daily
The S&P ($SPX) starts the week in a good position; fresh off a key support level and in the middle of our price channel. Tell me if you've heard this one before: the ADX is showing a weak trend. At least the directional indicators are supporting of an uptrend (DI+ is greater than DI-). One of these days I'll find a momentum indicator to supplement the ADX.

2018-09-16 - SPX Technical Analysis - Weekly
Extending our view, we see the expected increase in trading volume, and the January high acting as a support level last week.
And since we've successfully recovered the January high, it's a good time to check your asset allocation levels and/or take some profits. Remember: bulls make money, bears make money, pigs get slaughtered.
If you find this research helpful, please tell a friend. If you don't find it helpful, tell an enemy. I share articles and other news of interest via Twitter; you can follow me @investsafely. The weekly market outlook is also posted on Facebook and Linkedin.
You can check out how well (or poorly) the outlook has performed as a stand-alone, signal generator using past performance estimates:
- 2015 Performance - Stock Market Outlook
- 2016 Performance - Stock Market Outlook
- 2017 Performance - Stock Market Outlook
For the detailed Elliott Wave Analysis, go to the ELLIOTT WAVE lives on by Tony Caldaro. Charts provided courtesy of stockcharts.com.
Popular Pages
- Jim Cramer- Personal Incomes Statements
- Hyperinflation
- Calculating Beta
- SMART Financial Goals
Blogroll
- Advisor Perspectives- Dividend Growth Investor
- Elliott Wave Lives On
- On My Radar | CMG Wealth
- Sure Dividend
- The Big Picture
- The Fat Pitch
- Thoughts from the Frontline
- Trader Feed
Sponsored Links
Invest Safely provides valuable, time-saving info about personal finance, money management, and investing.


