Weekend Stock Market Outlook
Stock Market Outlook For The Week of
January 20th = Uptrend
INDICATORS
20/50 Day Moving Averages: Uptrend
Price & Volume Action: Uptrend
Objective Elliott Wave Analysis: Uptrend
Another solid week of gains in the stock markets has the weekend market outlook showing green. Reports of progress on a trade deal with China seems to be the catalyst. Watch the $VIX; it's approaching 16, which has been a floor during the recent downtrend. And a short trading week this week, as US markets are closed Monday to observe Martin Luther King Day.
All the indexes start the week above their 50 day moving averages, with the S&P closing above that level on Thursday, which puts this signal back to an uptrend.
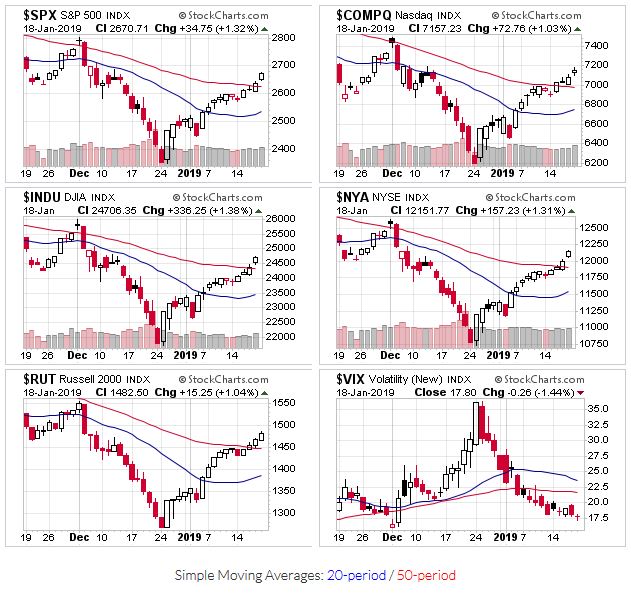
2019-01-20 - US Stock Market Averages
Price and volume also looks positive, with prices back above the 50-day moving average and accumulation days outpacing distribution. Overall, trading volume is still below average, and lower than I'd expect for the speed with which market prices have rebounded.
OEW is evaluating 5 criteria to determine if the market will retest the December low, or if the bear market has already ended: the size of rally, NDX/NAZ and SPX/DOW wave patterns, rebound percentage from the low, and breadth rise from the low. Right now, the size/percentage of the rally and NDX/NAZ criteria point to an end to the bear market, putting the odds of an uptrend at 60%. So this signal switches to an uptrend as well.

2019-01-20 - SPX Trendline Analysis - Daily
The S&P ($SPX) punched through the 2,600 resistance level mentioned in the last update. The DI+ / DI- crossed over early in the week, supporting the case for an uptrend. Next up is the downward trendline created in 2018 Q4; piercing that level would confirm an end the bear market.

2019-01-20 - SPX Trendline Analysis - Weekly
Switching to a weekly view, prices appear to have broken the downtrend created in Q4. But there hasn't been a higher "low", in terms of closing prices yet, so it's hard to define the new uptrend. Weekly prices have closed at or near the high for the past 4 weeks, creating a steep trendline. Even a trend drawn through the intra-week lows is steep. At this rate, the S&P would be back to the 2018 Q3 highs within the next 3-4 weeks!
The situation reminds me of the last week in November 2018. All the signals went green and everyone pointed towards a year-end rally. Then KABLAMO, prices dropped like a rock. It just feels like a whipsaw is coming, and within the next week or two, I'll be writing about a signal change again. Fool me once, shame on you. Fool me twice...participate and protect indeed.
If you find this research helpful, please tell a friend. If you don't find it helpful, tell an enemy. I share articles and other news of interest via Twitter; you can follow me @investsafely. The weekly market outlook is also posted on Facebook and Linkedin.
Once a year, I review the market outlook signals as if they were a mechanical trading system, while pointing out issues and making adjustments. The goal is to give you to give you an example of how to analyze and continuously improve your own systems.
- 2015 Performance - Stock Market Outlook
- 2016 Performance - Stock Market Outlook
- 2017 Performance - Stock Market Outlook
For the detailed Elliott Wave Analysis, go to the ELLIOTT WAVE lives on by Tony Caldaro. Charts provided courtesy of stockcharts.com.
Popular Pages
- Jim Cramer- Personal Incomes Statements
- Hyperinflation
- Calculating Beta
- SMART Financial Goals
Blogroll
- Advisor Perspectives- Dividend Growth Investor
- Elliott Wave Lives On
- On My Radar | CMG Wealth
- Sure Dividend
- The Big Picture
- The Fat Pitch
- Thoughts from the Frontline
- Trader Feed
Sponsored Links
Invest Safely provides valuable, time-saving info about personal finance, money management, and investing.


