Weekend Stock Market Outlook
Stock Market Outlook For The Week of
January 13th = Downtrend
INDICATORS
20/50 Day Moving Averages: Downtrend
Price & Volume Action: Mixed
Objective Elliott Wave Analysis: Downtrend
Constructive price action continues, but so does the downtrend.
All of the indexes are above their 20 day and are posed to test their 50 day moving averages. Continuing the prior week's trend, prices rose while trading volume declined; not the best situation for a new uptrend. A few growth stocks did indeed break-out, but not nearly enough to power the markets higher. I'm still looking for indexes to break above their 50-day moving average before changing these signals.

2019-01-13 - US Stock Market Averages
OEW continues to signal a downtrend. Tony reiterated his call that the S&P takes another run at the lows before calling a bottom, and provided some research to bolster the claim:
-
"While all this was going on we were doing some research into historical market activity that is similar to this. We found five events[…]. In every one of the five instances the market rallied between 7.5% to 13% after the significant low. In four of the five instances, when the rally concluded, the market retested the lows. The one exception still had a 61.8% pullback.
We also looked into momentum measures...there are only three instances. In each of the three instances momentum rose 20% to 25% before the market reversed and went back to retest the lows. It is currently up 17%.
Probabilities suggest a decline soon that mostly likely retests the lows."
The S&P ($SPX) maintained upward momentum last week, but ran into resistance around 2600. Prices reached a high of 2595,2597,2596 on Wednesday, Thursday, and Friday, respectively. Combined with falling trading volumes, we may have just found a near-term high.

2019-01-13 - SPX Technical Analysis - Daily
Switching to a weekly view, the market closed at its 10-week moving average; could this be contributing to the lack of progress we saw on the daily chart during the back half of last week?
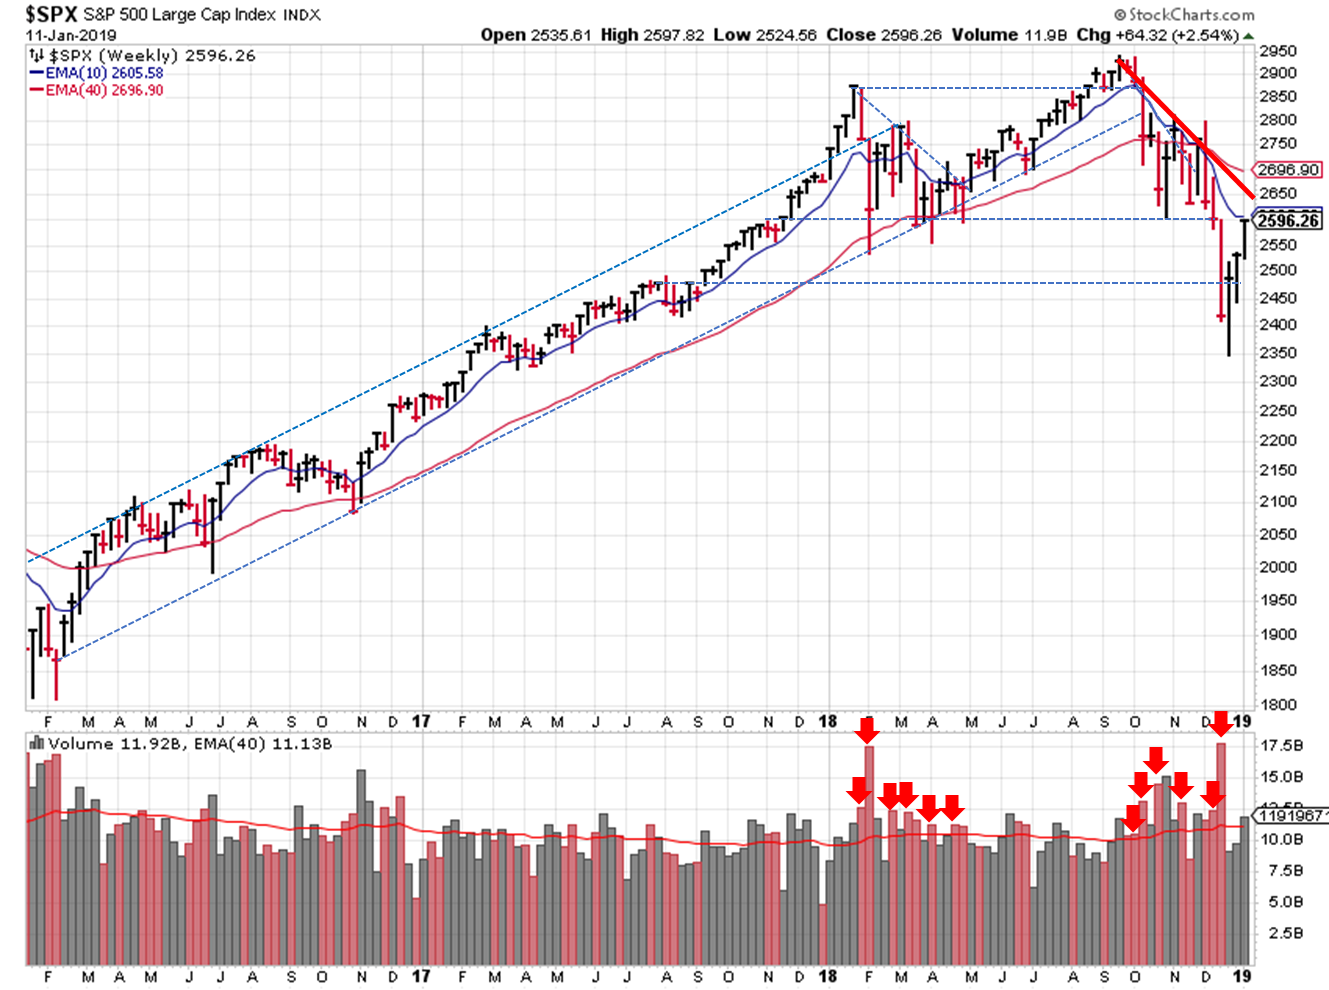
2019-01-13 - SPX Technical Analysis - Weekly
Either way, the weekly view indicates that we should see a confirmation of direction soon, because the downtrend line rests at 2,650 (+2%), and the 40-week moving average is right around 2,700 (+4%).
Are we out of the weeds? I have no idea. I know where I'd like them to go, but the markets tend to discount my opinion...as they do everyone else's. The Fat-Pitch has some historical perspective this week, similar to OEW, with a positive twist:
-
"Sharp falls of at least 15% have a strong tendency to have their original low retested in the weeks/months ahead. But what is notable this time is the exceptional breadth that has driven the indices higher: in the past 70 years, this has never taken place within the context of a bear market. The Christmas low may still get retested, but it seems likely to hold and new highs are probably ahead. Nothing in the stock market is ever guaranteed, but this has been the consistent, historical pattern."
We'll need a catalyst to turn the rally into a new uptrend; "FANG" earnings maybe?
If you find this research helpful, please tell a friend. If you don't find it helpful, tell an enemy. I share articles and other news of interest via Twitter; you can follow me @investsafely. The weekly market outlook is also posted on Facebook and Linkedin.
You can check out how well (or poorly) the outlook has performed as a stand-alone, signal generator using past performance estimates:
- 2015 Performance - Stock Market Outlook
- 2016 Performance - Stock Market Outlook
- 2017 Performance - Stock Market Outlook
For the detailed Elliott Wave Analysis, go to the ELLIOTT WAVE lives on by Tony Caldaro. Charts provided courtesy of stockcharts.com.
Popular Pages
- Jim Cramer- Personal Incomes Statements
- Hyperinflation
- Calculating Beta
- SMART Financial Goals
Blogroll
- Advisor Perspectives- Dividend Growth Investor
- Elliott Wave Lives On
- On My Radar | CMG Wealth
- Sure Dividend
- The Big Picture
- The Fat Pitch
- Thoughts from the Frontline
- Trader Feed
Sponsored Links
Invest Safely provides valuable, time-saving info about personal finance, money management, and investing.


