Weekend Stock Market Outlook
Stock Market Outlook For The Week of
November 18th = Downtrend
INDICATORS
20/50 Day Moving Averages: Downtrend
Price & Volume Action: Mixed
Objective Elliott Wave Analysis: Mixed
A difficult week to judge, but sticking with a downtrend for now. In the end, preserving capital is key so caution is the name of the game right now.
This week starts with major indexes back below their 50-day moving averages. Most fell below their 20-day moving averages last week as well, but were able to recover by the close on Friday... the lone exception being the NASDAQ.

2018-11-18- US Stock Market Averages
The price/volume signal switches to a mixed signal because we picked up a couple distribution days and we weren't able to hold a key moving averages (200 day). Neither of which is what you want to see early in an uptrend. Also, the best performing stocks aren't exactly "growth stocks" (car parts, retail, drug stores).
OEW indicates an uptrend within the overall downtrend. So far, OEWs expectation for a sell off to ~2,700 was the right call, as prices found support at that level on Wednesday and Thursday. If the analysis holds, a rally to +2800 will follow over the next few weeks, before we fall again towards 2,400.
The S&P ($SPX) couldn't hold its 200 day moving average, and retreated last week. In the process, it "filled" both gap ups in the recent uptrend. There was price support around ~2,700, as OEW expected.

2018-11-18 - SPX Technical Analysis - Daily
Looking at the long-term picture, the S&P should confirm the uptrend or downtrend this week...unless it moves completely sideways and closes at the same price as last week.
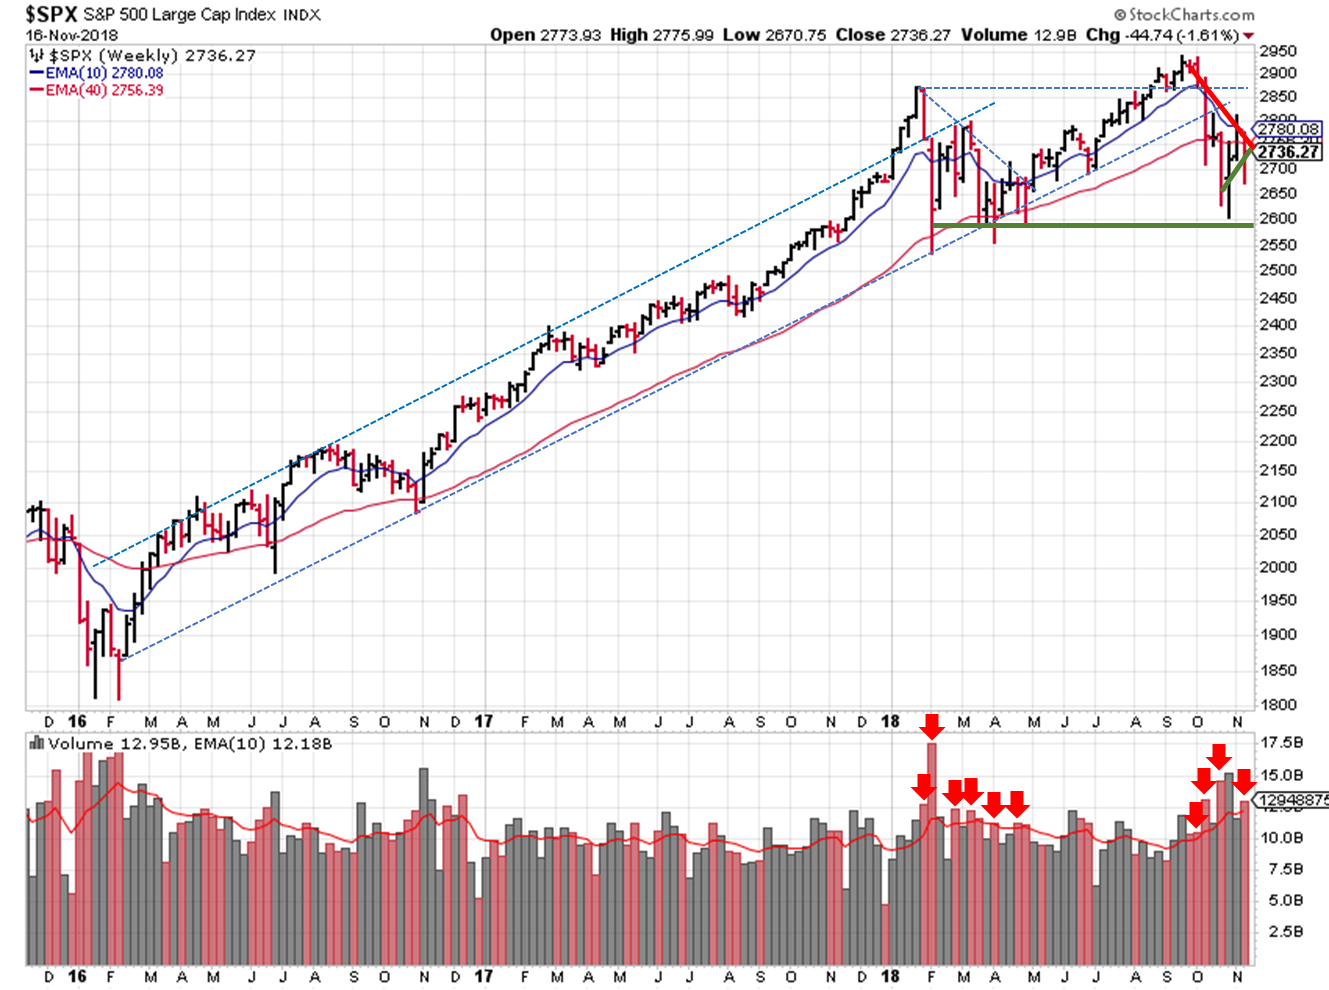
2018-11-18 - SPX Technical Analysis - Weekly
To summarize, the moving averages didn't provide much support last week, so the downtrend signal remains in place. The price/volume indicator shifted to from uptrend to mixed. OEW is still mixed, but shows a short-term uptrend within the overall downtrend. You could argue that the price/volume indicator has an uptrend bias since it hasn't shown an outright downtrend yet. And OEW could be interpreted as an uptrend for the near term. This interpretation would show 2 of the 3 signals in uptrend mode, and initiate a trend change.
So what to do? My expectation is that we rally higher from here. We may even get back above the 50-day moving average, which would shift the overall signal back to an uptrend...albeit missing out on a ~2% price increase. The characteristics of the market are different (volatility, etc.), so you need to make sure your signals are appropriate. Keep your losses small, and don't be in a hurry to initiate large positions.
Participate. Protect. Prepare.
If you find this research helpful, please tell a friend. If you don't find it helpful, tell an enemy. I share articles and other news of interest via Twitter; you can follow me @investsafely. The weekly market outlook is also posted on Facebook and Linkedin.
You can check out how well (or poorly) the outlook has performed as a stand-alone, signal generator using past performance estimates:
- 2015 Performance - Stock Market Outlook
- 2016 Performance - Stock Market Outlook
- 2017 Performance - Stock Market Outlook
For the detailed Elliott Wave Analysis, go to the ELLIOTT WAVE lives on by Tony Caldaro. Charts provided courtesy of stockcharts.com.
Popular Pages
- Jim Cramer- Personal Incomes Statements
- Hyperinflation
- Calculating Beta
- SMART Financial Goals
Blogroll
- Advisor Perspectives- Dividend Growth Investor
- Elliott Wave Lives On
- On My Radar | CMG Wealth
- Sure Dividend
- The Big Picture
- The Fat Pitch
- Thoughts from the Frontline
- Trader Feed
Sponsored Links
Invest Safely provides valuable, time-saving info about personal finance, money management, and investing.


