Weekend Stock Market Outlook
Stock Market Outlook For The Week of
September 9th = Uptrend
INDICATORS
20/50 Day Moving Averages: Uptrend
Price & Volume Action: Uptrend
Objective Elliott Wave Analysis: Uptrend
Good guess last week; the markets sold off after hitting a new high. I'm expecting an increase in trading volume this week (more like a return to somewhat normal trading volumes). Anything is possible at this point; maybe we take a run at new highs, maybe we look for support at the 50 day.
All the indexes are above their 50 day moving averages. The S&P500 and Russell 2000 are sitting on their 20 day moving averages, while the Nasdaq and NYSE are below that level.
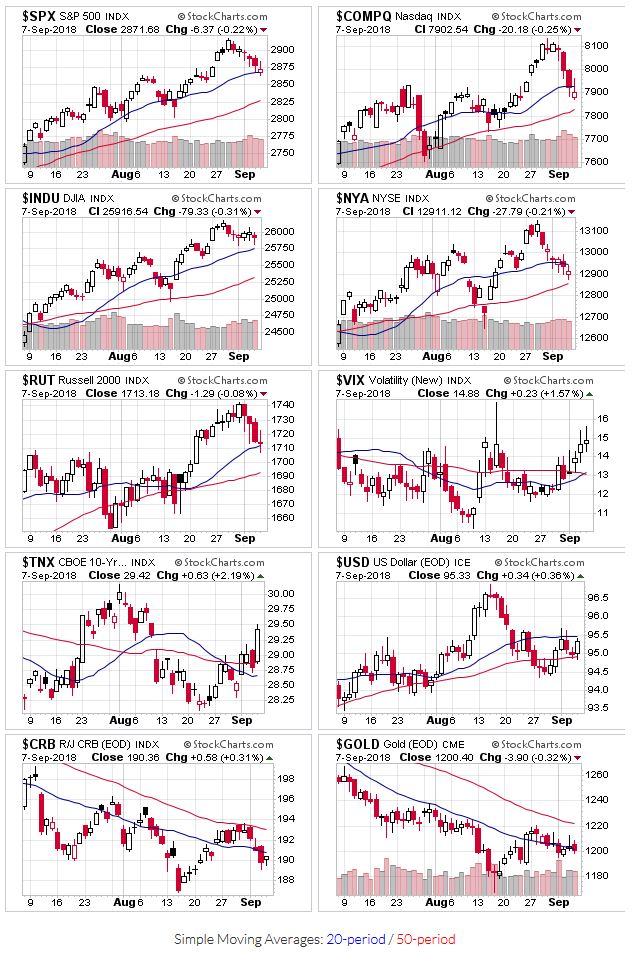
2018-09-09 - US Stock Market Averages
Most of the indexes added 2 distribution days to their counts, putting the S&P's total at 5. That's a bit elevated, but given the lack of overall volume, not too concerning. If trading volume picks up this week, accumulation/distribution days will be more impactful.
OEW still has an uptrend signal in place.

2018-09-09 - SPX Technical Analysis - Daily
As mentioned at the start, the S&P ($SPX) sold off last week. On the bright side, prices are still above key technical support levels and our price channel remains intact. The ADX turned over...no surprise given 4 consecutive days of lower closing prices. But the directional indicators are essentially even. That's a long way of saying there's no change in outlook based on last week's action.
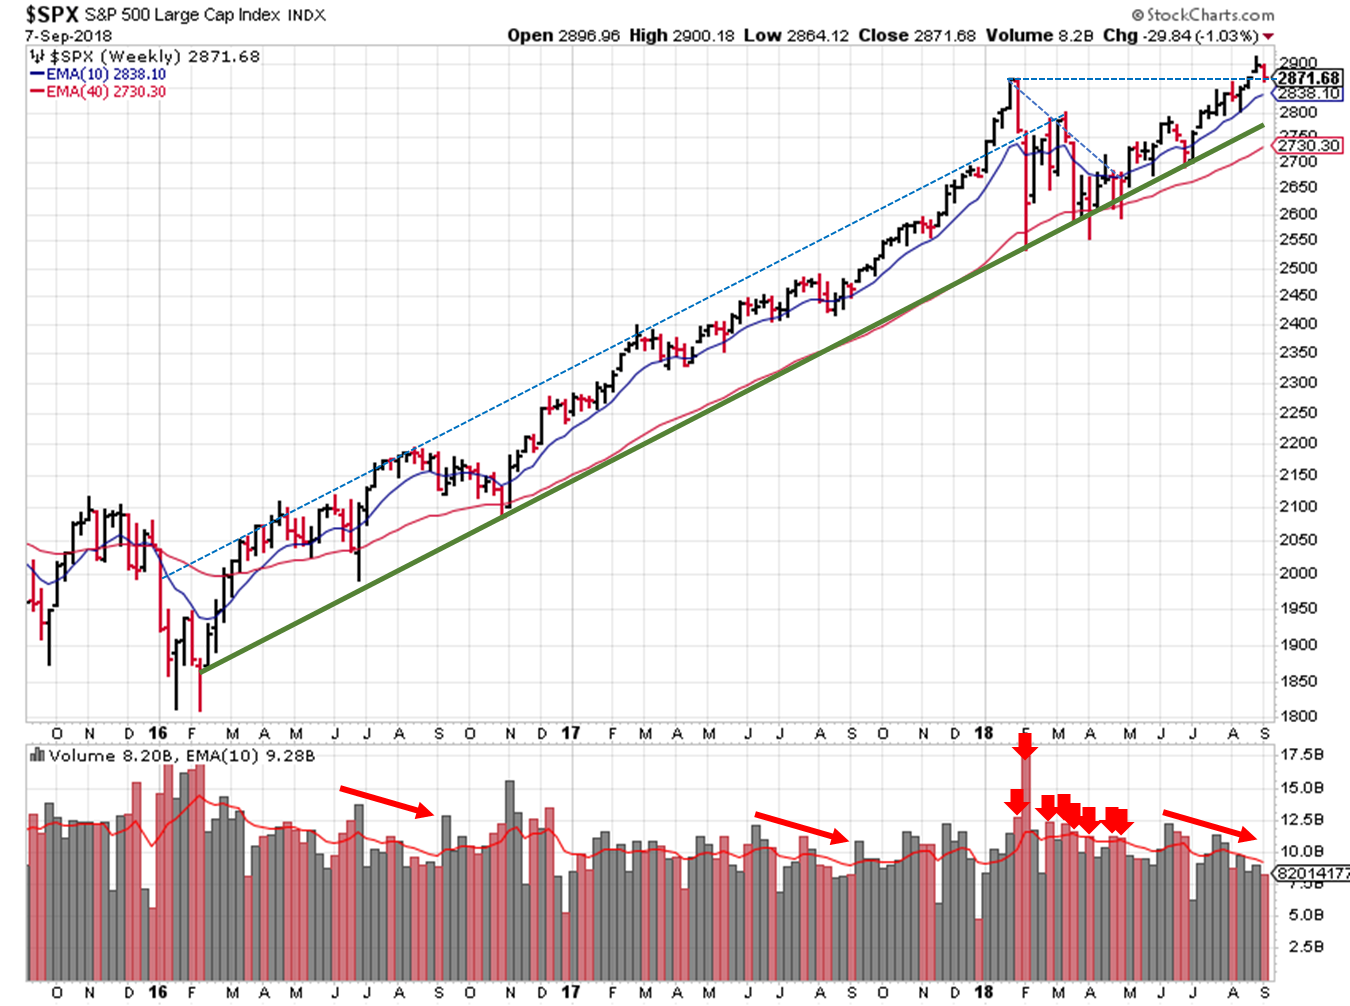
2018-09-09 - SPX Technical Analysis - Weekly
Extending the view, the January high could act as support this week. Hopefully it holds, and we rally back to new highs over the next few weeks.
Participant, protect, and prepare.
If you find this research helpful, please tell a friend. If you don't find it helpful, tell an enemy. I share articles and other news of interest via Twitter; you can follow me @investsafely. The weekly market outlook is also posted on Facebook and Linkedin.
You can check out how well (or poorly) the outlook has performed as a stand-alone, signal generator using past performance estimates:
- 2015 Performance - Stock Market Outlook
- 2016 Performance - Stock Market Outlook
- 2017 Performance - Stock Market Outlook
For the detailed Elliott Wave Analysis, go to the ELLIOTT WAVE lives on by Tony Caldaro. Charts provided courtesy of stockcharts.com.
Popular Pages
- Jim Cramer- Personal Incomes Statements
- Hyperinflation
- Calculating Beta
- SMART Financial Goals
Blogroll
- Advisor Perspectives- Dividend Growth Investor
- Elliott Wave Lives On
- On My Radar | CMG Wealth
- Sure Dividend
- The Big Picture
- The Fat Pitch
- Thoughts from the Frontline
- Trader Feed
Sponsored Links
Invest Safely provides valuable, time-saving info about personal finance, money management, and investing.


