Weekend Stock Market Outlook
Stock Market Outlook For The Week of
August 27th = Downtrend
INDICATORS
20/50 Day Moving Averages: Downtrend
Price & Volume Action: Downtrend
Objective Elliott Wave Analysis: Downtrend
A strong showing last Tuesday put stock indexes above their 50 day moving averages, but they failed to hold that level by Friday's close. So this week starts with the downtrend intact.
All the indexes begin this week under their 20 day moving averages. Aside from the DJIA, they're all under their 50 day moving average as well. The Russell 2000 remains in bear market territory, starting the week below its 200 day moving average.
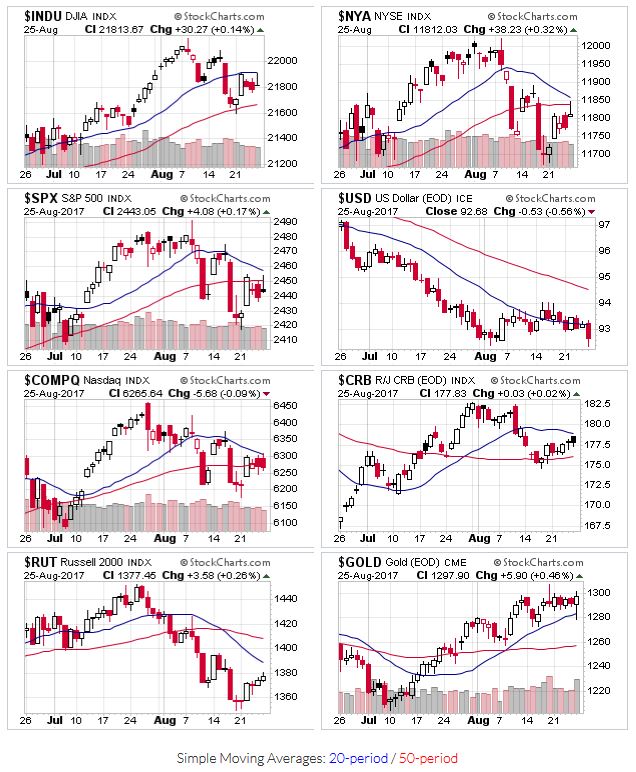
2017-08-27-US Stock Market Averages
No change in the price/volume action last week, so we start this week with the downtrend signal.
OEW still shows a probable downtrend, but continues to wait for confirmation. As mentioned last week, declines during this bull market have been short-lived after an OEW confirmation.
Last week didn't see any changes in the price action of growth names that made my selection screen (base failures, low-volume breakouts that subsequently failed), so I continue to watch and wait. None of this is really surprising; August and September have been the worst two months of the year for stocks, over the last 29 years, based on the average monthly price change
If you find this research helpful, please tell a friend. I share articles and other news of interest via Twitter; you can follow me @investsafely. The weekly market outlook is also posted on Facebook and Linkedin.
You can check out how well (or poorly) the outlook has tracked the market using past performance estimates:
For the detailed Elliott Wave Analysis, go to the ELLIOTT WAVE lives on by Tony Caldaro. Charts provided courtesy of stockcharts.com.
Popular Pages
- Jim Cramer- Personal Incomes Statements
- Hyperinflation
- Calculating Beta
- SMART Financial Goals
Blogroll
- Advisor Perspectives- Dividend Growth Investor
- Elliott Wave Lives On
- On My Radar | CMG Wealth
- Sure Dividend
- The Big Picture
- The Fat Pitch
- Thoughts from the Frontline
- Trader Feed
Sponsored Links
Invest Safely provides valuable, time-saving info about personal finance, money management, and investing.


