MACD - A Simple and Effective Momentum Indicator
The MACD is a buy and sell signal generator...which means it can tell you when to buy shares, and when to sell shares.
MACD is an abbreviations for Moving Average Convergence Divergence. I've always heard it pronounced as "MAC-DEE".

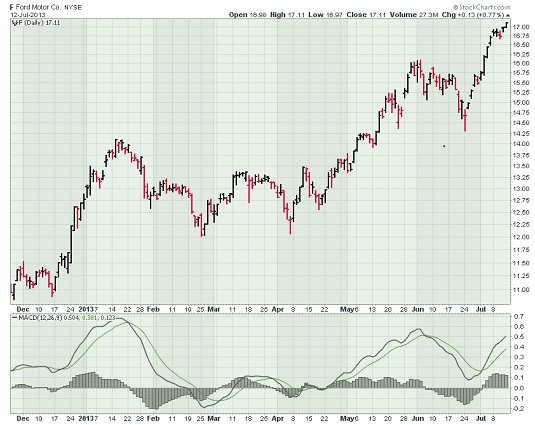
Chart courtesy of Stockcharts.com
MACD Basics
The MACD is based on moving averages - specifically exponential moving averages (called EMAs).By comparing two different EMAs, the MACD attempts to capture changes in price trends.
The standard settings for MACD EMAs are 12-periods and 26-periods. I use periods because you can use the MACD on daily, weekly or monthly charts, which could mean 12 and 26 days, weeks, or months!
By comparing differences in the change of that line to an average, an analyst can identify subtle shifts in the strength and direction of a stock's trend.
MACD(x,y,z) is a common format for describing the periods you're using. For example, if you selected an standard MACD for a daily stock chart, you would get see MACD(12,26,9) on the chart.
- Short-Term EMA = 12 days
- Long-Term EMA = 26 days
- Average = 9 days
How to Use MACD
You can also adjust the sensitivity of the MACD.More sensitivity - use a shorter short-term moving average and a longer long-term moving average. MACD(5,35,5) is more sensitive than MACD(12,26,9) and might be better suited for weekly charts.
Less sensitivity - use a longer short-term moving average and a longer long-term moving average. A less sensitive MACD will still oscillate above/below zero, but crossover signals will be less frequent.
When NOT to Use MACD
The MACD is NOT good for identifying when a stock is overbought or oversold.In addition, the MACD is calculated using actual prices, so you cannot compare MACD values between different stocks.
If you want to make a comparison, you need to use an indicator that uses percentages (such as the Percentage Price Oscillator).
Types of MACD Signals
- Cross-Overs
- Signal Line Cross-Over
- Zero Cross-Over
- Divergence
- Dramatic rise
How to Interpret MACD Signals
CAUTION:
The MACD can generate "false" signals.


