Stock Market Outlook
2018 Performance
It's time! Time for the annual performance review of the Stock Market Outlook.

Back in 2014, I began publishing a weekly post detailing the current state for the U.S. stock markets, specifically the S&P500.
The outlook is one piece of an investing process; an example for determining whether to put your money to work or take it off the table.
But it’s not enough to just monitor the market. You need to translate that knowledge into action. To that end, I created a simple trading system using rules and criteria for entering and exiting trades based on the weekly market outlook signals (e.g. the “execute” step in the safe investing process).
Example trades come with example profits and losses, so I can use those rules to estimate performance...another critical piece of the “monitor” step in your investing process.
At the start of 2016, I posted the first annual review, examining the outlook, the opportunities & challenges that come with translating signals into trades, as well as refinements that can improve performance.
So without further ado, let’s get started.
Looking Back
In 2015, the market outlook model was a success. The signals and subsequent trades protected capital from losses and even generated some profit; buy and hold returns from the general markets were flat or even negative.In 2016, the trades continued to limit losses, but price movements between the time of signal generation and placing a trade influenced results significantly. As part of that year’s review, I changed the way I selected a price to represent a more realistic trade, and performance improved substantially.
In 2017, the trading model underperformed the market. Shallow sell-offs and the signal/trade delay were the main causes. I covered potential issues with the signals themselves (two were based on moving averages, making one redundant). But the cumulative performance since 2015 was still pretty good, so no changes were made.
Stock Market Outlook - 2018
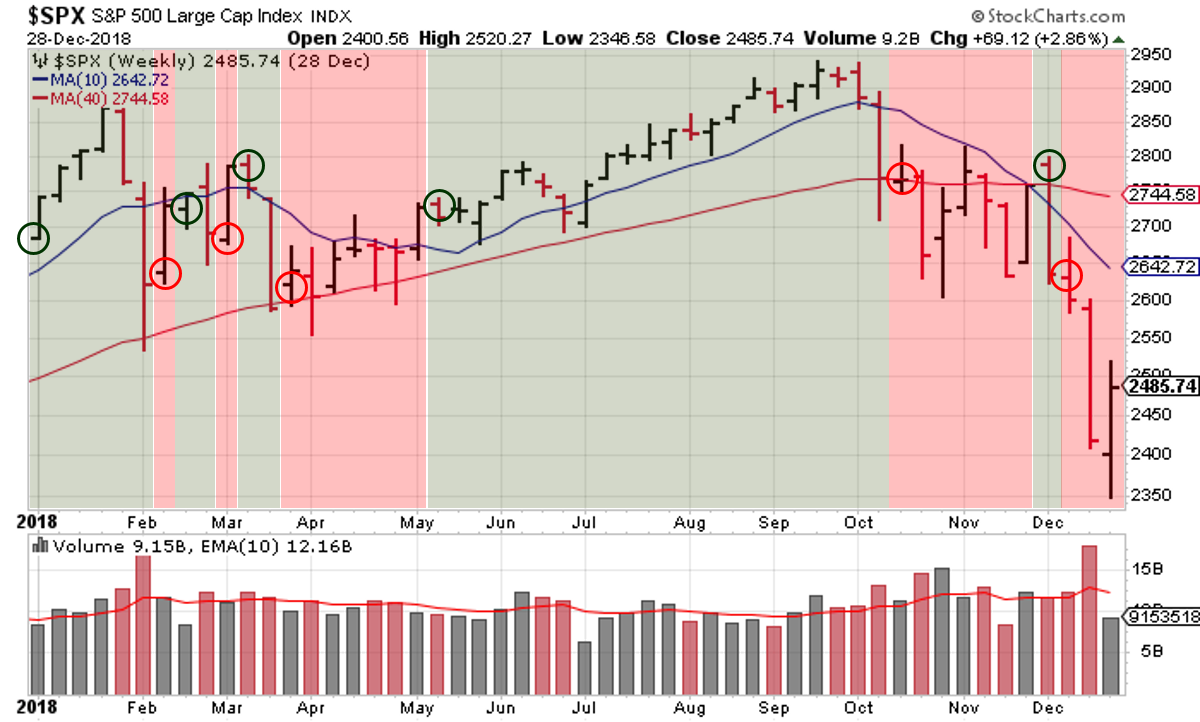
2018 started off with a bang, as the S&P shoot up almost 7% in January. Then, over the course of 2 weeks (late January and early February, the market sold off ~12%! Our first “real” correction in years.Trading seemed to quiet down in Q2 and Q3 and the S&P went back to all-time highs; ~10% gain from the start of the year. Then the other shoe dropped, and the market fell ~20% from its peak in Q4.
I fully expected the trading system to generate a loss, but a smaller one than the market. I was actually hoping for a gain, just like 2015. HAHA! Yes! This is going to be a big year!
Trading Model – 2018 Performance
Returns were negative…and 2x worse than buy and hold! Wait, WHAT?!
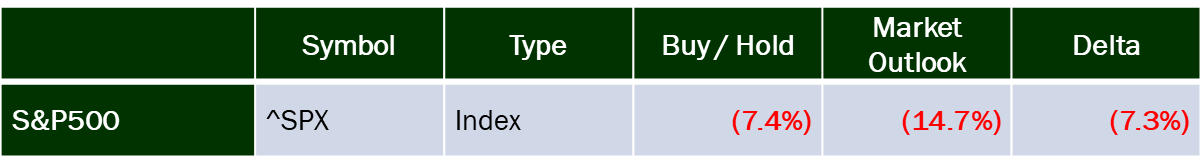
The goal of the market outlook is limiting losses. Looking at the performance table above, the trading system failed spectacularly. What the hell happened?
Analysis
What happened? Market volatility, that’s what happened. Look at January through March or October through December. The stock markets haven’t experienced price movements like that for a long time. The last week in January saw a price change of ~9%! The first week in December was ~7%.If we zoom in on the last trade in March, you can see the impact of price volatility on the trading system. A “buy” would have been entered on March 12th, per the trading criteria.
The S&P was right at the 50-day / 10 week moving average that weekend, so no signal change heading into the week of March 19th. Then, the S&P opened below the 50-day / 10 week moving average, generated a sell signal, and continued to fall during the week. A “sell” would have been entered on March 26th, per the trading criteria.
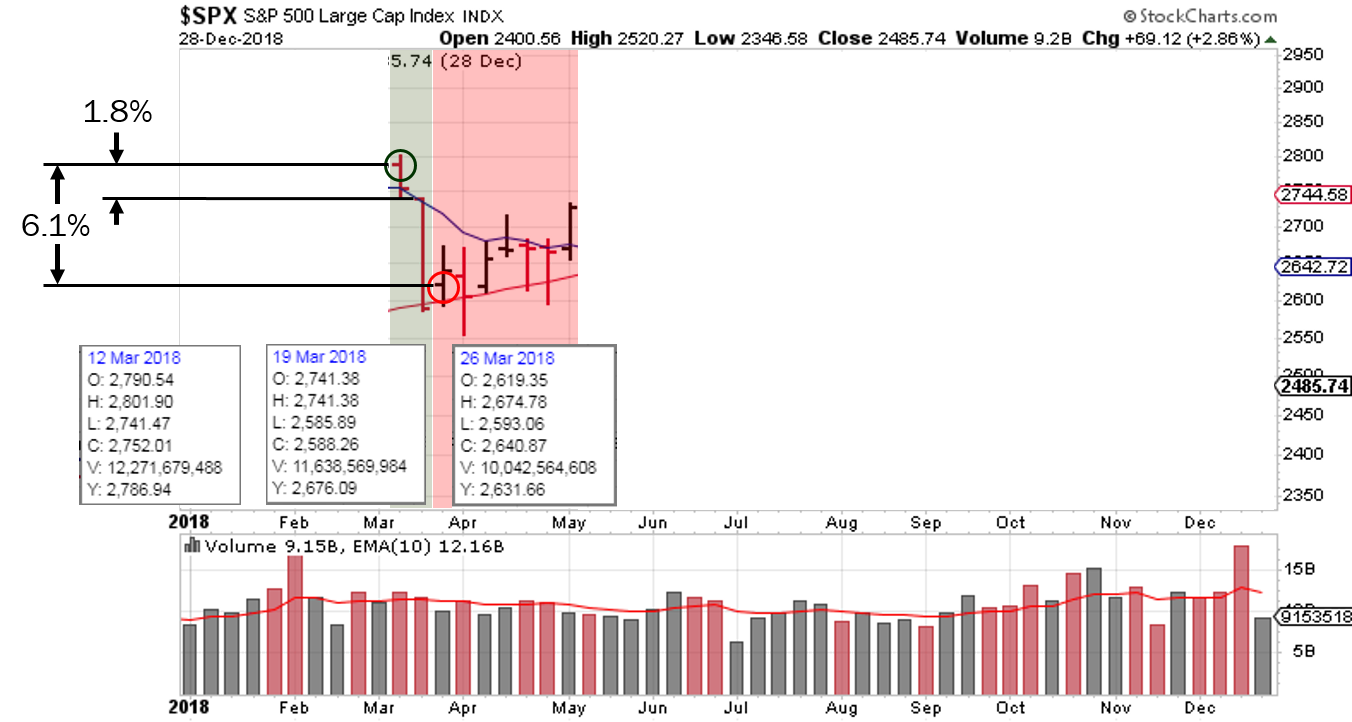
Using the existing “rules”, trades are placed using the opening price the week following a signal change. That trade would have lost ~6%. Selling the position immediately after the breakdown (e.g. with a stop loss at the 50-day moving average or even and at the opening price on March 20th), the trade would have netted a loss of ~2%.
A similar problem occurred in late November, in an even shorter timeframe!
So, is the market outlook wrong? Is the trading system wrong? Or is the issue some combination of the two?
These symptoms aren’t new; both the timing of trades and the indicators have been discussed in prior outlooks. But it appears the low volatility environment hid their severity. I reflected on this for a while and did a lot of excel work.
The market outlook is essentially a description of the market conditions as they are at the time of the blog post. If the signals changed during the week based on daily price action (50-day moving averages, distribution days, trendline analysis using a daily view, etc.), I describe the results and change the outlook. At the end of the year, I pull together all the signals, model the execution of trades, and calculate performance.
And there’s a big disconnect. The model doesn't generate a trade when the signal is actually generated. If I want to trade using weekly prices, I need to track weekly indicators (verses a summary of daily indicators on a weekly basis!). I erroneously used my blogging schedule as the trading schedule.
To evaluate the impact, I needed to determine the results of executing trades at the beginning of a trading day, rather than the trading week. This required some additional work, because OEW analysis is only posted on Wednesday and Sunday.
Luckily, requiring the alignment 2 out of 3 signals to change the outlook reduced the chances that errors (in my extrapolation of OEW) would impact performance.
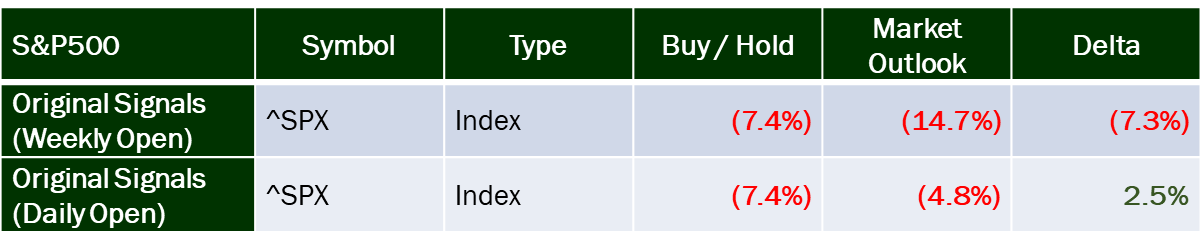
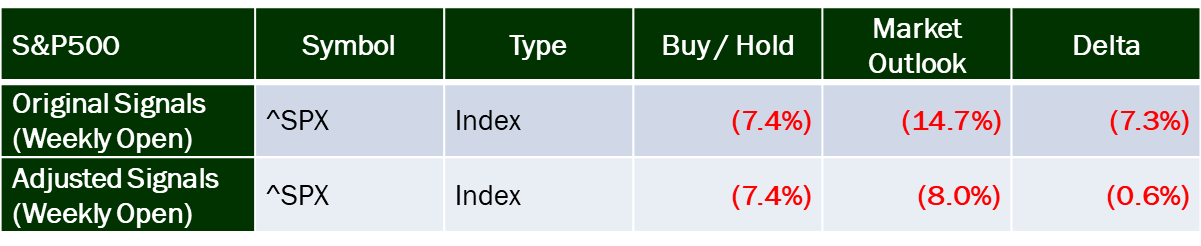
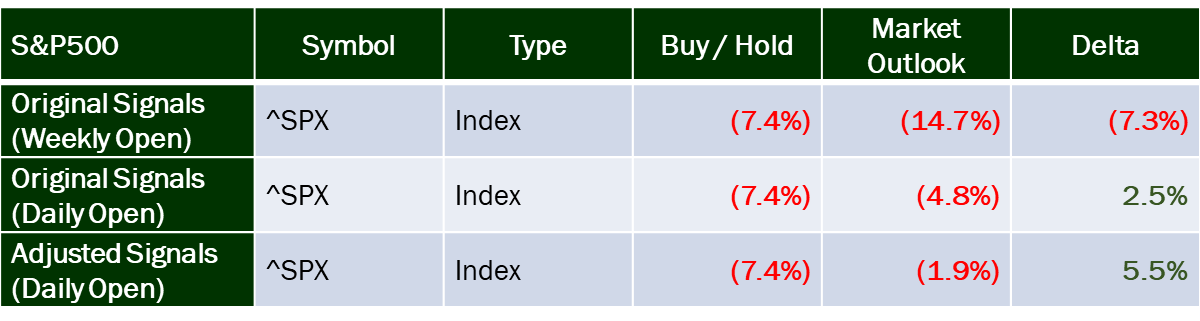
Moving to a daily signal improves the original market outlook signals substantially…no wonder I was surprised at performance using the weekly prices. It’s safe to say that there is a major problem with my model.
But the outlook isn’t off the hook just yet. Last year, overall performance was okay, but I knew the outlook could be improved. At the time, I said:
- There is a potential problem with the current signals. I want three unique viewpoints, but the moving average and the price/volume overlap; both use the 50-day moving average.
I had hoped using the state of a few indexes (DJIA, NASDAQ, Russel 2000) verses their 50-day moving average would work, but that doesn’t appear to be the case. You’ve seen the ADX (more specifically the DI+ and DI- indicators for bullish/bearish trends) in the weekly posts for almost a year, as a potential replacement for the 50-day moving average. Here’s a comparison of adding a version of the ADX to outlook.
Replacing the 50-day moving average with a version of the ADX improved performance, without moving to a daily signal. That said, trend changes still required 2 of 3 signals to align (majority rules), so the impact was more evolution than revolution. And a loss is still a loss, and that loss is bigger than buy and hold.
Adding the ADX and intraweek trade execution reveals the combined impact on performance.
So the market outlook could be improved, but the biggest issue was the way I decided to model trades at the end of the year.
Here’s how the new and improved signal would fair using actual S&P trading instruments, including commissions:
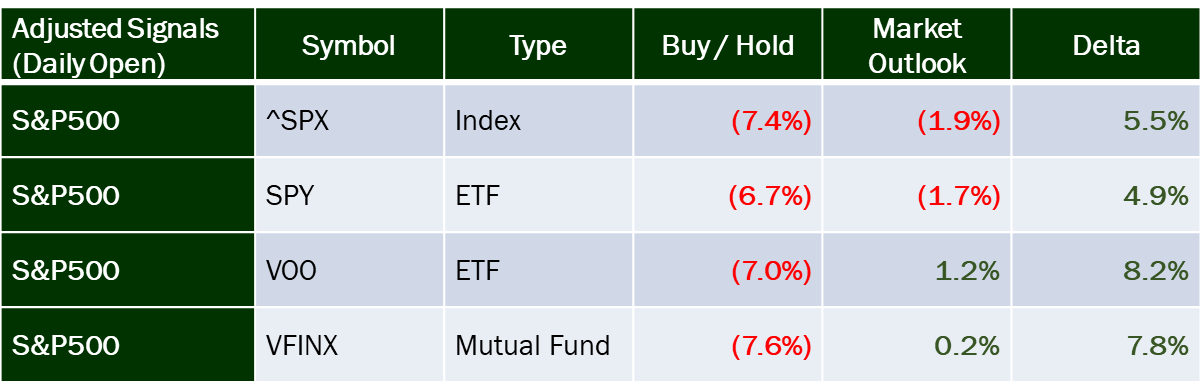
Even the small difference between funds can have a big impact on your returns!
Adjustments
The first adjustment is a nothing-burger. I can no longer get pricing information for FXSIX, so I dropped it from the performance matrix.The second adjustment impacts the analysis techniques used to assess the market conditions each week. In 2019, ADX DI/DI indicator will replace the 50-day SMA. I’ll also continue including basic technical analysis, in the form of trendlines, to illustrate the concept of support and resistance, as well as visualizing trends within trends (a rally within a bear market, a correction within a in a longer-term bull market, etc.).
The third change has the biggest impact on performance of the trading system (i.e. translating the signals into trades); namely using daily prices, rather than waiting for the weekend.
Looking Forward
I’m not sure what to expect in 2019. The U.S. government was shut-down for almost the entire month of January, and we only have a stop gap funding measure in place right now. Tariff impacts are working their way through the supply chain and into corporate financials, and the US still doesn’t have a trade deal with China…not to mention the slowing Chinese economy, Brexit, ballooning corporate debt, etc., etc., etc..Yet, despite all that, the U.S. equity markets made an impressive recovery from the brutal sell-off at the end of 2018, based on little more than the Fed backing off its interest rate and quantitative tightening policy!
I hope you find this information helpful. Please feel free to reach out to me if you have any questions.
Best Regards,
Joel
Invest Safely, LLC
If you find this research helpful, please tell a friend. If not, tell an enemy. I share articles and other news of interest via Twitter; you can follow me @investsafely. The weekly market outlook is also posted on Facebook and Linkedin.
--- APPENDIX ---
Remember: All models are wrong, but some are useful. The objective here is to give readers of my blog an example of systematically using an investing process, covering translating signals, executing trades, reviewing performance and adjusting methodologies. Providing this analysis (which mimics what I do for all my personal trading) gives you an example of the safe investing processes in action.
A Note on Investment Processes:
From an investing technique perspective, I’ve used trend following for many years. I find that using rule-based indicators, along with regular reviews, help me improve performance. As far as timing, my goal is to enter and exit positions in line with market trends, and you can see that bias reflected throughout the Weekend Market Outlook.
Data
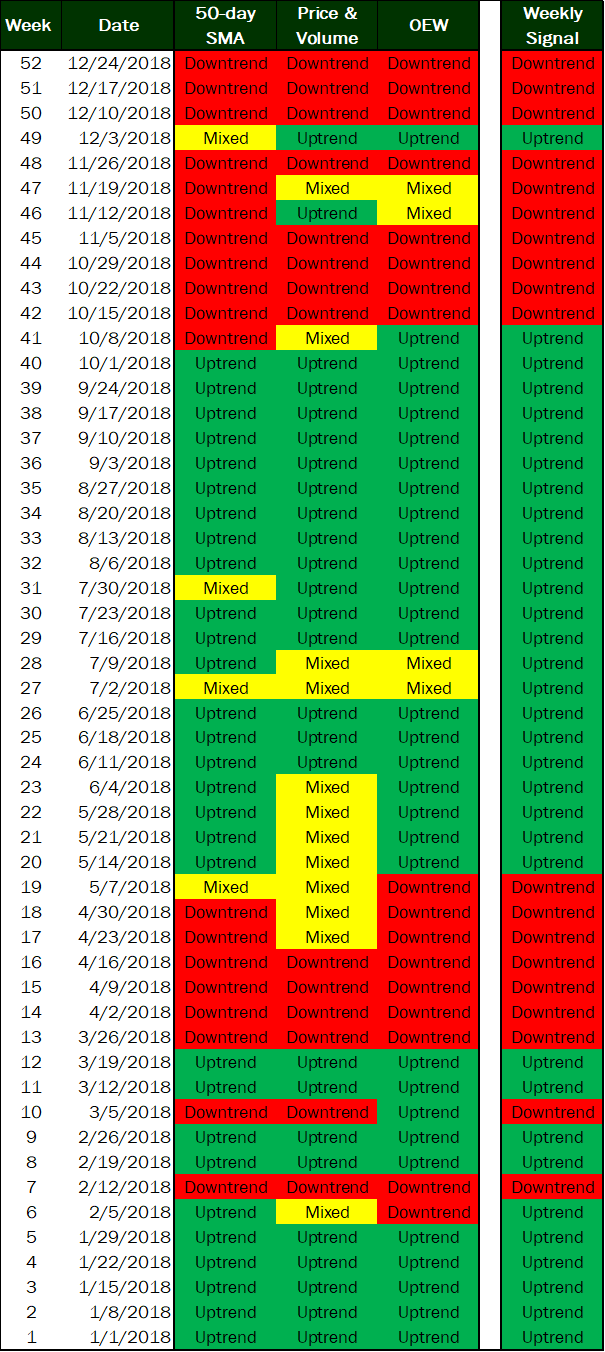
For analysis of the stock market outlook, I used historical data from Yahoo Finance.For reference, here is a graphic of the market outlook signals for 2018.
Methodology
The weekend stock market outlook continues to be based on the overall methodology from 2016; using 3 techniques to assess the state of the S&P 500. Each weekend, I determine whether the outlook (uptrend or downtrend) has changed, based on signals from those 3 methods. By cross-referencing three different methods and only changing the overall trend for the stock market outlook when they all align, I continue to attempt to reduce the number of false signals.For reference, the 2019 signals are:
- ADX (14 day) (Bullish/Bearish price trend)
- 50-day moving average + trading volumes (institutional investor behavior)
- Elliott Wave Theory (overall market behavior / psychology)
Trading Criteria – Investment Type
I base the signals and the trading model on the S&P500 benchmark index. The reason is twofold:
- The index is often used as a proxy for the general U.S. stock market
- You can’t buy it
I can provide you with educational materials and/or entertainment. In 2018, it was more than likely the latter! But I digress. Since we can’t directly buy shares of an index, I also show you an example of the signals if they were applied to the next best thing: funds. I use 3 S&P funds (SPY, VOO, and VFINX) to show you the variation that can occur between investing instruments…even ones that are supposedly the same.
Trading Criteria - Buy and Sell Prices
The forward looking outlook is posted on Sunday, based on stock market price action from the prior week. Since the outlook reviews signals at the end of the week, the assumption for 2019 is that trades will be entered at the opening price the day after a signal is generated. In previous performance assessments, the “price” used for calculating performance is the market open price the week following a signal change.Trading Criteria - Transaction Fees
I'm assuming that trades are placed in an account with Fidelity, so transaction cost is $4.95 per trade. Everyone should use a low-cost broker.Trading Criteria - Position Sizing
For this study, I used a position size of 100 shares to keep the math simple. If I were buying shares of an index ETF, my position size would be calculated based on the size of my total portfolio and my risk tolerance (how much I’m willing to lose before selling the position).Trading Criteria - Buy and Sell Signals
Shares are purchased if the market outlook changes to an uptrend. If the outlook is mixed, watch and wait. If the outlook changes to a downtrend, the entire position is sold.Issues & Objections - Trade Prices
If a signal is generated, simulated trades are entered based on the market's opening price on next trading day (this is a change for 2019).Are you always going to get the opening price? No. As an example, one astute observer pointed out that I’m using opening price across the board, yet it’s not possible to purchase mutual funds at their opening price.
Will the opening price always be the best price? No. Price slippage between your signal generation and trade execution is one of the reasons that individual results can and WILL vary…as shown in the 2018 performance review.
Issues & Objections - Trends & Timing
Are you always going to buy an uptrend, sit on your hands when the market is "mixed", or sell exactly when a downtrend takes hold? No. General trends are great for giving you a sense of the overall investing environment. But each position needs to be evaluated on its own merits.For instance, there were several times in 2018 when the stock market outlook had been in an uptrend for a few weeks before any of my individual stock trades were executed.
IMPORTANT DISCLOSURE INFORMATION This material is for general communication and is provided for informational and/or educational purposes only. None of the content should be viewed as a suggestion that you take or refrain from taking any action nor as a recommendation for any specific investment product, strategy, or other such purpose. Certain information contained herein has been obtained from third-party sources believed to be reliable, but we cannot guarantee its accuracy or completeness.
To the extent that a reader has any questions regarding the applicability of any specific issue discussed above to his/her individual situation, he/she is encouraged to consult with the professional advisors of his/her choosing. Invest Safely, LLC is not a law firm, certified public accounting firm, or registered investment advisor and no portion of its content should be construed as legal, accounting, or investment advice.
The material is not to be construed as an offer or a recommendation to buy or sell a security nor is it to be construed as investment advice. Additionally, the material accessible through this website does not constitute a representation that the investments described herein are suitable or appropriate for any person.
Hypothetical Presentations:
Any referenced performance is “as calculated” using the referenced funds and has not been independently verified. This presentation does not discuss, directly or indirectly, the amount of the profits or losses, realized or unrealized, by any reader or contributor, from any specific funds or securities.
The author and/or any reader may have experienced materially different performance based upon various factors during the corresponding time periods. To the extent that any portion of the content reflects hypothetical results that were achieved by means of the retroactive application of a back-tested model, such results have inherent limitations, including:
- Model results do not reflect the results of actual trading using assets, but were achieved by means of the retroactive application of the referenced models, certain aspects of which may have been designed with the benefit of hindsight
- Back-tested performance may not reflect the impact that any material market or economic factors might have had on the use of a trading model if the model had been used during the period to actually manage assets
- Actual investment results during the corresponding time periods may have been materially different from those portrayed in the model
The S&P 500 Composite Total Return Index (the "S&P") is a market capitalization-weighted index of 500 widely held stocks often used as a proxy for the stock market. Standard & Poor's chooses the member companies for the S&P based on market size, liquidity, and industry group representation. Included are the common stocks of industrial, financial, utility, and transportation companies. The S&P is not an index into which an investor can directly invest. The historical S&P performance results (and those of all other indices) are provided exclusively for comparison purposes only, so as to provide general comparative information to assist an individual in determining whether the performance of a specific portfolio or model meets, or continues to meet investment objective(s). The model and indices performance results do not reflect the impact of taxes.
Investing involves risk (even the “safe” kind)! Past performance does not guarantee or indicate future results. Different types of investments involve varying degrees of underlying risk. Therefore, do not assume that future performance of any specific investment or investment strategy be suitable for your portfolio or individual situation, will be profitable, equal any historical performance level(s), or prove successful (including the investments and/or investment strategies describe on this site).
Popular Pages
- Jim Cramer- Personal Incomes Statements
- Hyperinflation
- Calculating Beta
- SMART Financial Goals
Blogroll
- Advisor Perspectives- Dividend Growth Investor
- Elliott Wave Lives On
- On My Radar | CMG Wealth
- Sure Dividend
- The Big Picture
- The Fat Pitch
- Thoughts from the Frontline
- Trader Feed
Sponsored Links
Invest Safely provides valuable, time-saving info about personal finance, money management, and investing.


