Weekend Stock Market Outlook
Stock Market Outlook For The Week of
March 18th = Uptrend
INDICATORS
20/50 Day Moving Averages: Uptrend
Price & Volume Action: Uptrend
Objective Elliott Wave Analysis: Uptrend
The stock market outlook remains in uptrend territory to kick off the first week of spring. All eyes will be on the U.S. Federal Reserve this week; another quarter-point rate hike is expected by the end of their 2-day meeting.
Most of the indexes remain above their 20 and 50 day moving averages. The DJIA lags other averages, sitting below both those technical indicators.
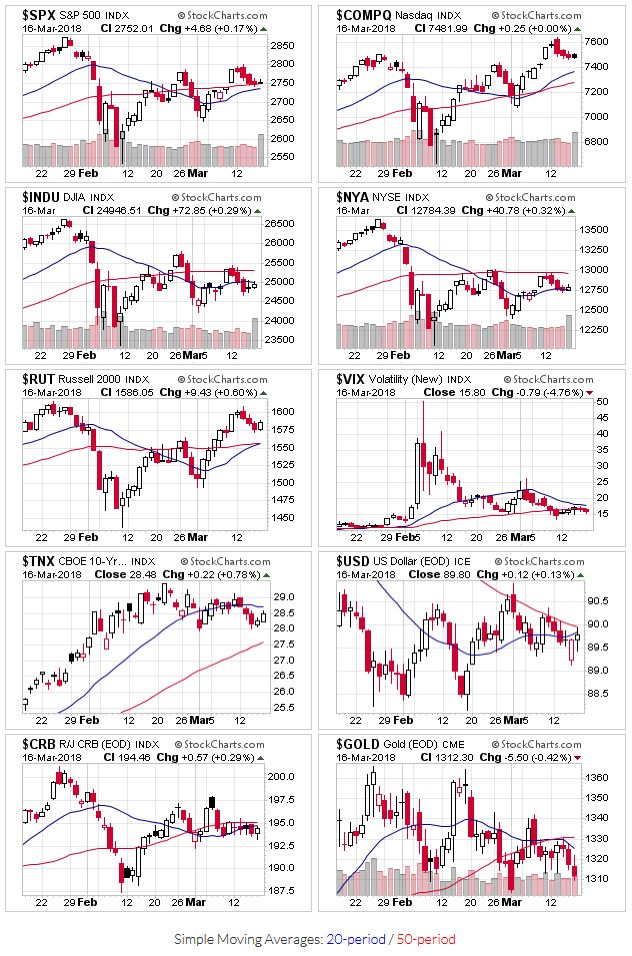
2018-03-18-US Stock Market Averages
Price and volume action also stays in uptrend territory. The distribution day count remains manageable. Note: Trading volume spiked last Friday on option / futures contract expirations.
OEW remains in an uptrend. In a nod to the bulls, Tony no longer sees a massive sell-off anytime soon, stating:
- After a January all-time high of SPX 2873, ending a strong 10-month uptrend. A drop of nearly 12% in two weeks followed. The perma-bears were back out in force. The crash they keep calling for has already occurred: 2007-2009. Those types of events only occur once in a lifetime. There will be bear markets in the future. But nothing like that for a very long time.
I'm looking for a potential replacement for the 20/50 day moving average; an indicator that works well when markets are volatile and/or extended from trending indicators such as moving averages. The Average Directional Index (ADX) caught my eye because it flashed a sell signal for the $SPX just ahead of the February sell off. At the moment, it's showing a bearish environment (DI- is higher than DI+) that's weakening (ADX is declining).
If you find this research helpful, please tell a friend. If you don't find it helpful, tell an enemy. I share articles and other news of interest via Twitter; you can follow me @investsafely. The weekly market outlook is also posted on Facebook and Linkedin.
You can check out how well (or poorly) the outlook has tracked the market using past performance estimates:
- 2015 Performance - Stock Market Outlook
- 2016 Performance - Stock Market Outlook
- 2017 Performance - Stock Market Outlook
For the detailed Elliott Wave Analysis, go to the ELLIOTT WAVE lives on by Tony Caldaro. Charts provided courtesy of stockcharts.com.
Popular Pages
- Jim Cramer- Personal Incomes Statements
- Hyperinflation
- Calculating Beta
- SMART Financial Goals
Blogroll
- Advisor Perspectives- Dividend Growth Investor
- Elliott Wave Lives On
- On My Radar | CMG Wealth
- Sure Dividend
- The Big Picture
- The Fat Pitch
- Thoughts from the Frontline
- Trader Feed
Sponsored Links
Invest Safely provides valuable, time-saving info about personal finance, money management, and investing.


