Weekend Stock Market Outlook
Stock Market Outlook For The Week of
April 16th = Downtrend
INDICATORS
20/50 Day Moving Averages: Downtrend
Price & Volume Action: Mixed
Objective Elliott Wave Analysis: Downtrend
Investors used the shortened trading week to take some money off the table, with U.S. stock indexes grinding lower. Will last week's hypothesis holds true? Will institutional investors step in and slowly rotate into new sectors? For now, the outlook has changed to a downtrend while we await the answer.
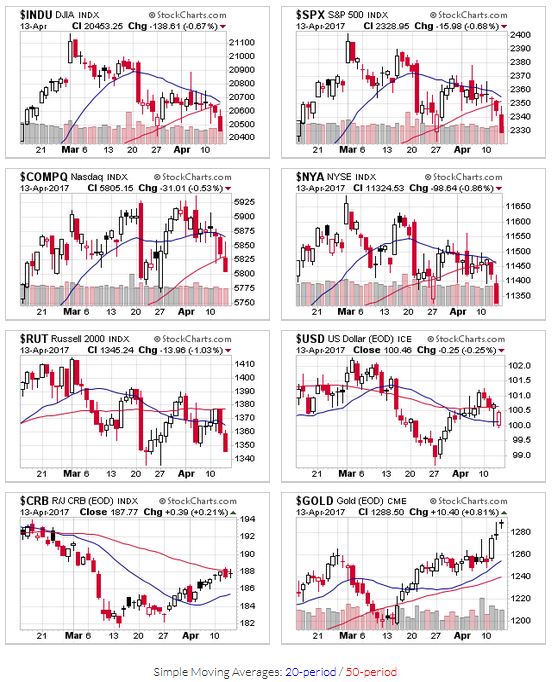
All the indexes ended the week below their 20 and 50 day moving averages, confirming a downtrend from a moving average perspective. The "official" bull/bear support level (200 day moving average) is within striking distance. The NASDAQ, being the strongest index of late, is naturally the most extended from the 200 day moving average, sitting ~7% above that level as of Friday. Next is the DJIA at ~6%, the S&P at 4.5%, and the NYSE at 3%.
2017-04-16-US Stock Market Averages
Following suit, price volume action also deteriorated. Distribution days are elevated for all but the Nasdaq. The S&P500 has 8, the NYSE and DJIA have 7, while the NASD only has 4. The silver lining here is that trading volumes have been lower than average for the past few weeks, meaning that the selling is likely related to rebalancing holdings rather than outright liquidation.
That said, many of the leading stocks I follow have either broken key support levels or failed to break-out entirely, so we'll have to wait and see which sectors are the new favorites.
OEW also changed to a downtrend, but restated the "good news":
- "When OEW signals a downtrend confirmed, it is likely that the correction will be nearly over. This kind of activity has happened quite often in the past 8 years"
The market averages are still close to their all time highs; the S&P sits ~3% off that mark. Most of the downward price moves we've seen since 2016 have been right around 3%, with the two major exceptions being the run up to Brexit and the US Presidential election. If the trend continues, the time we spend in this downtrend will be minimal.
If you find this research helpful, please tell a friend. I share articles and other news of interest via Twitter; you can follow me @investsafely. The weekly market outlook is also posted on Facebook and Linkedin.
You can check out how well (or poorly) the outlook has tracked the market using past performance estimates:
For the detailed Elliott Wave Analysis, go to the ELLIOTT WAVE lives on by Tony Caldaro. Charts provided courtesy of stockcharts.com.


