Stock Market Outlook - Feb 7, 2016
Stock Market Outlook entering the Week of February 7th = Downtrend
MOVING AVERAGES
Short-term (20 DMA): Downtrend
4 of the 5 major stock market averages fell below their 20-day moving averages.
Intermediate (50 DMA): Downtrend
All the major stock market averages remained below their 50-day moving averages.
Long-term (200 DMA): Downtrend
All the major stock market averages remained below their 200-day moving averages.

2016-02-07 - US Stock Market Averages
COMMENTARYIn stark contrast to the previous weekend outlook, Friday's negative price action helped US equities lose the ground they had gained (e.g. the 20-day moving average). Price/volume action continues to be weak (in terms of supporting a rally).
Again, now is not the time to take large positions in the market, especially if you don't use hedging strategies. You run the risk of buying a Tableau or a LinkedIn. On Friday, Tableau Software (DATA) fell 49% and LinkedIn (LNKD) fell 44%. In ONE trading session!

2016-02 - Tableau Software Price Chart
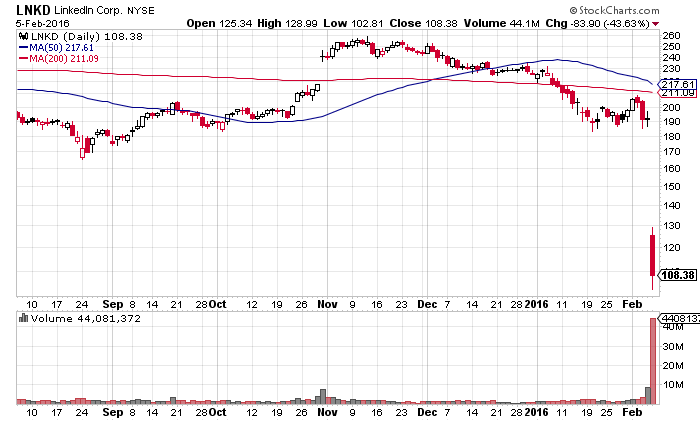
2016-02 - Linkedin Stock Price Chart
While this is only one point in time, and we don't know how quickly these prices will recover (if at all), you always want to preserve capital. And in the current environment, holding large, long positions makes that goal difficult.
For the detailed Elliott Wave Analysis, go to the ELLIOTT WAVE lives on by Tony Caldaro.Charts courtesy of StockCharts.com.
Moving Average Signals:
Uptrend = Market indexes remained above their moving average during the trading week
Downtrend = Market indexes remained below their moving average during the trading week
Buy signal = Market indexes rose above their moving averages during the trading week
Sell signal = Market indexes fell below their moving averages during the trading week
Popular Pages
- Jim Cramer- Personal Incomes Statements
- Hyperinflation
- Calculating Beta
- SMART Financial Goals
Blogroll
- Advisor Perspectives- Dividend Growth Investor
- Elliott Wave Lives On
- On My Radar | CMG Wealth
- Sure Dividend
- The Big Picture
- The Fat Pitch
- Thoughts from the Frontline
- Trader Feed
Sponsored Links
Invest Safely provides valuable, time-saving info about personal finance, money management, and investing.


